Reproduce a paper with Distill
R Markdown for paper reproduction
Scientific and technical writing is generally written using Word, or Google Docs. Think about whether you could reproduce these formats without copy and paste. You could always use LaTeX, but you’d have to learn an entirely new syntax.
Why R Markdown?
Reproducibility!
Avoiding errors
Several output options: PDF, HTML, Word, LaTeX
Citation formatting made easy
Collaboration
Your documents will be prettier than most!
Why distill?
There are several R Markdown templates to produce papers, such as those in rticles and bookdown These are basically all made to have a journal print format, which though is nice, they aren’t always the best for electronic reading.
Enter distill, a package that’s best known for designing websites using R Markdown. You can however also write papers! The output format is very clean and readable. Note that you can take all of your R Markdown script and paste it into another template if you wish.
Specific benefits:
Reader-friendly that adapts to mobile devices
Compatible with LaTeX math, citations, and footnotes
Flexible figure layout (larger width than article text)
Attractively rendered tables
Support for diagramming tools
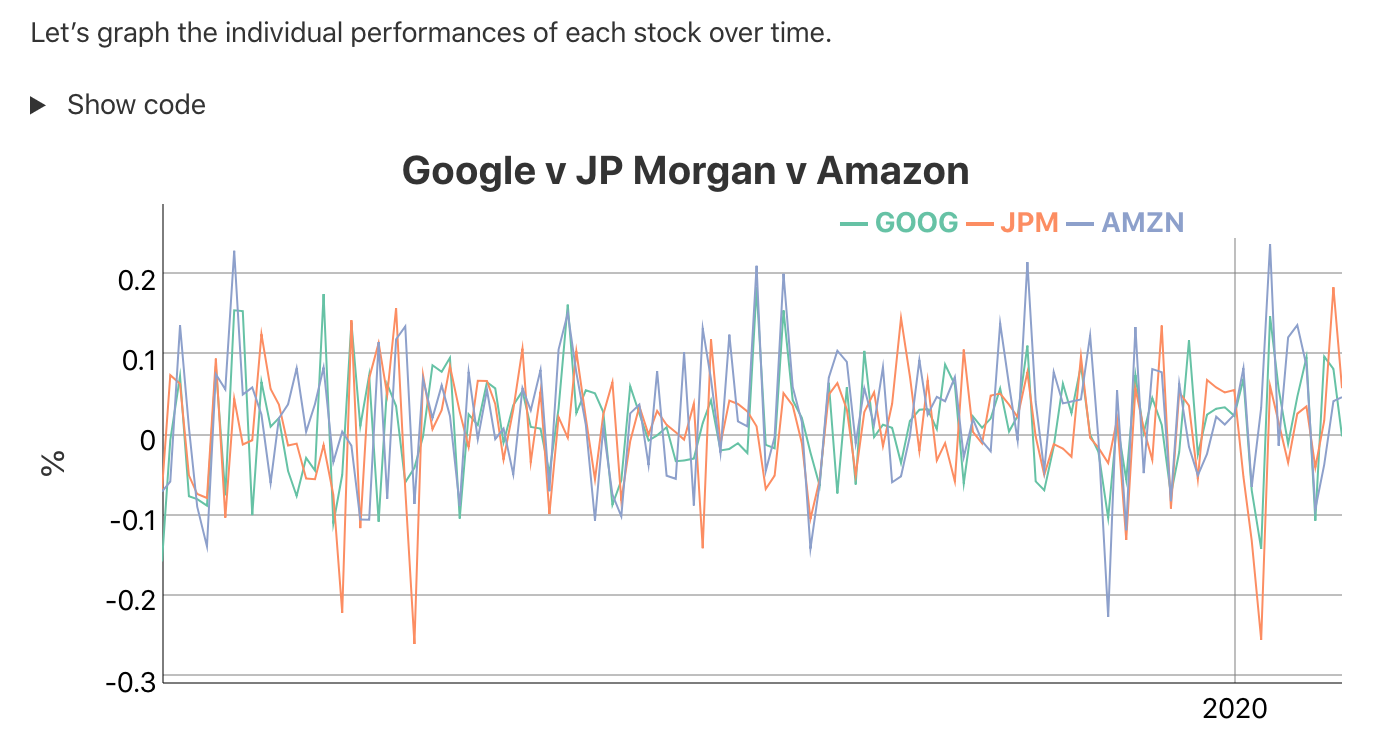
Interactive visualizations through JavaScript and D3
A variety of ways to publish articles, including sets of articles as a Distill website or as a Distill blog
All of these features help scientists communicate their work more efficiently through the web and R.
Required setup
Install distill and other packages
# Install pacman to install and load all others
install.packages("pacman")

# Install & load all other packages
pacman::p_load(distill,
               ggpubr,
               ggthemes,
               here,
               kableExtra,
               rmarkdown,
               tidyverse)

# Set global ggplot() theme
theme_set(theme_pubclean(base_size = 16))

# Remove legend
theme_update(legend.position = "none")

# Shift axes title to their relative right
theme_update(axis.title = element_text(hjust = 1))

# Remove axes ticks
theme_update(axis.ticks = element_blank())

# Colorblind friendly palette
cbp1 <- c("#999999", "#E69F00", "#56B4E9", "#009E73",
          "#F0E442", "#0072B2", "#D55E00", "#CC79A7")
Creating an article
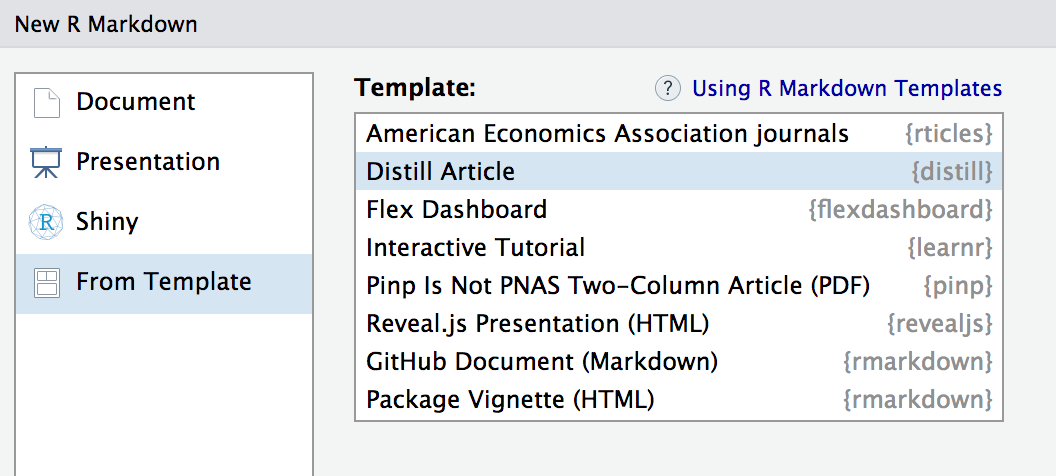
Start by clicking File > New File > R Markdown > From Template > Distill Article

Alternatively, you can create a Distill article in the console
distill::create_article("article.Rmd")Distill articles include a title, description, data, author/affiliation, and bibliography in their YAML:
---
title: "Reproduce a paper with Distill"
description: |
  Example Distill R Markdown paper to use as a template for reproducible scientific and technical writing
author:
  - name: Greg Chism
    url: https://gregtchism.netlify.app/
    affiliation: Data Science Institiute, University of Arizona, Tucson AZ, USA
    affiliation_url: https://datascience.arizona.edu/
    orchid_id: 0000-0002-5478-2445
date: "2022-11-17"
output: distill::distill_article:
---Date
The date field is denoted as month, day, year or as year, month, day (various notations are supported but only in these orders)
Bibliography
Denoded with the bibliography field, this refers to a Bibtex file that contains all sources cited in the article. See the citations resource for more information.
Figures
Distill makes integrating figures into your article straightforward, where the default is the width of the article.
data <- read.csv(here("Repro_Research_rrtools", "data", "diabetes.csv")) |>
    mutate(Age_group = ifelse(Age >= 21 & Age <= 30, "Young",
                            ifelse(Age > 30 & Age <= 50, "Middle",
                                   "Elderly")))

# Plot Glucose vs. Age group
data |>
  ggplot(aes(x = Glucose, y = fct_rev(Age_group), fill = Age_group)) +
    geom_boxplot() +
    xlab("Glucose (mg/dl)") +
    ylab("Age group") +
    scale_fill_manual(values = cbp1)
You can also add additional horizontal space if needed, which can be accomplished through the layout chunk.
For example, let’s make a faceted plot a outside the bounds of the article text, with the l-body-outset layout in the layout chunk.
{r layout="l-body-outset", fig.width=6, fig.height=2}Note that when specifying a layout you should also specify an appropriate fig.width and fig.height for that layout. These values don’t determine the absolute size of the figure (that’s dynamic based on the layout) but they do determine the aspect ratio of the figure.
See the documentation on figure layout for details on additional layout options.
Tables
Distill articles can render several HTML options for displaying data frames. For example, pages_table() displays a page-able view of our data.
data |>
    rmarkdown::paged_table()
You can use layout = "l-body-outset" here as with the figure above to occupy more horizontal space than the article text. All of available figure layout options work as expected for tables.
See the documentation on table display for details on the various techniques available for rendering tables.
Equations
Embedded math equations are supported via standard markdown MathJax syntax. For example, the following LaTeX math:
$$
\sigma = \sqrt{ \frac{1}{N} \sum_{i=1}^N (x_i -\mu)^2}
$$
\[ \sigma = \sqrt{ \frac{1}{N} \sum_{i=1}^N (x_i -\mu)^2} \]
Citations
Bibtex is the supported way to make academic citations. To include citations, first create a bibtex file and refer to it from the bibliography field of the YAML front-matter (as illustrated above).
For example, your bibliography file might contain:
@Book{xie2015,
  title = {Dynamic Documents with R and knitr},
  author = {Yihui Xie},
  publisher = {Chapman and Hall/CRC},
  address = {Boca Raton, Florida},
  year = {2015},
  edition = {2nd},
  note = {ISBN 978-1498716963},
  url = {http://yihui.name/knitr/},
}
Citations are made in the article text with R Markdown notation (e.g., @xie2015), which refers to the ID provided in the bibliography. Multiple IDs can be provided, separated by semicolons.
If you have an appendix, a bibliography is automatically created and populated in it.
See the article on citations for additional details on using citations, including how to provide the metadata required to make your article more easily citable for others.
Footnotes and asides
Footnotes use Pandoc markdown notation, for example ^[This will become a hover-able footnote]. The number of the footnote will be automatically generated. 1
Notes can also be made in the gutter of the article (to the right of article text), done using the <aside> tag.
You can also include figures in the gutter, done by enclosing the code chunk which generates the figure within <aside> tags:
Table of contents
You can add a table of contents using the toc option and specify the depths of headers that it will occupy using toc_depth option.
---
title: "Reproduce a paper with Distill"
description: |
  Example Distill R Markdown paper to use as a template for reproducible scientific and technical writing
output: distill::distill_article:
    toc: true
    toc_depth: 2
---
The default table of contents depth is 3, so there will be levels 1, 2, and 3 headers included in the table of contents.
The table of contents automatically floats to the left when the article is displayed at 1000px wide or greater. To show the table of contents on top, specify toc_float: false
output:
  distill::distill_article:
    toc: true
    toc_float: false
Code blocks
Distill does not show the code for chunks from which an output is produced (knitr option echo = FALSE)
echo = FALSE reflects that Distill articles often present the results of analyses and not the underlying code. By setting echo = TRUE, the code will also be displayed.
1 + 1You can also include code that is only displayed by specifying eval = FALSE
1 + 1There are several default values that Distill uses for knitr chunk options (these defaults also reflect the use case of presenting results/output rather than underlying code):
| Option | Value | Comment |
|---|---|---|
echo |
FALSE |
Don’t print code by default. |
warning |
FALSE |
Don’t print warnings by default. |
message |
FALSE |
Don’t print R messages by default. |
comment |
NA |
Don’t preface R output with a comment. |
R.options |
list(width = 70) |
70 character wide console output. |
Keeping R code and output at 70 characters wide (or less) is best for readability across devices and screen sizes.
The defaults can be overridden for each code chunk, but you can also set global default. Note that a ‘#’ is in place to prevent it from running in the document.
# ```{r setup, include = FALSE}
knitr::opts_chunk$set(
  echo = TRUE,
  warning = TRUE,
  message = TRUE,
  comment = "##",
  R.options = list(width = 60)
)
```
Code folding
code_folding can be used to hide code by default but readers can optionally show it.
---
title: "Reproduce a paper with Distill"
description: |
  Example Distill R Markdown paper to use as a template for reproducible scientific and technical writing
output: distill::distill_article:
    code_folding: true
---
You can also make code_folding a per-chunk basis
1 + 1Provide a string rather than TRUE to customize the caption (the default is “Show code”).
Syntax highlighting
Syntax highlighting for R code is done via the downlit package, which provides automatic linking of R functions to their online documentation. By default, highlighting is done using colors optimized for accessibility and color contrast.
You can customize highlighting behavior using the highlight and highlight_downlit options. For example, to use the Pandoc “haddock” highlighting theme and disable the use of downlit, you would do this:
---
title: "Reproduce a paper with Distill"
description: |
  Example Distill R Markdown paper to use as a template for reproducible scientific and technical writing
output: distill::distill_article:
          highlight: haddock
          highlight_downlit: false
---
Available options for highlight include:
| Option(s) | Description |
|---|---|
default |
Default (accessible) theme |
rstudio |
RStudio editor theme |
haddock, kate, monochrome, pygments, tango |
Pandoc highlighting themes. |
Path to .theme file |
Custom Pandoc theme file. |
Appendices
Appendices can be added after your article by adding the .appendix class to any level 1 or level 2 header. For example:
## Acknowledgments {.appendix}
This is a place to recognize people and institutions. It may also be a good place to acknowledge and cite software that makes your work possible.

## Author Contributions {.appendix}
We strongly encourage you to include an author contributions statement briefly describing what each author did.
Footnotes and references will be included in the same section, immediately beneath any custom appendices.
Theming
The appearance of a Distill article can be customized using a theme and CSS just like Distill sites and blogs. You can use the create_theme() function to add a theme CSS file in the current working directory.
For example:
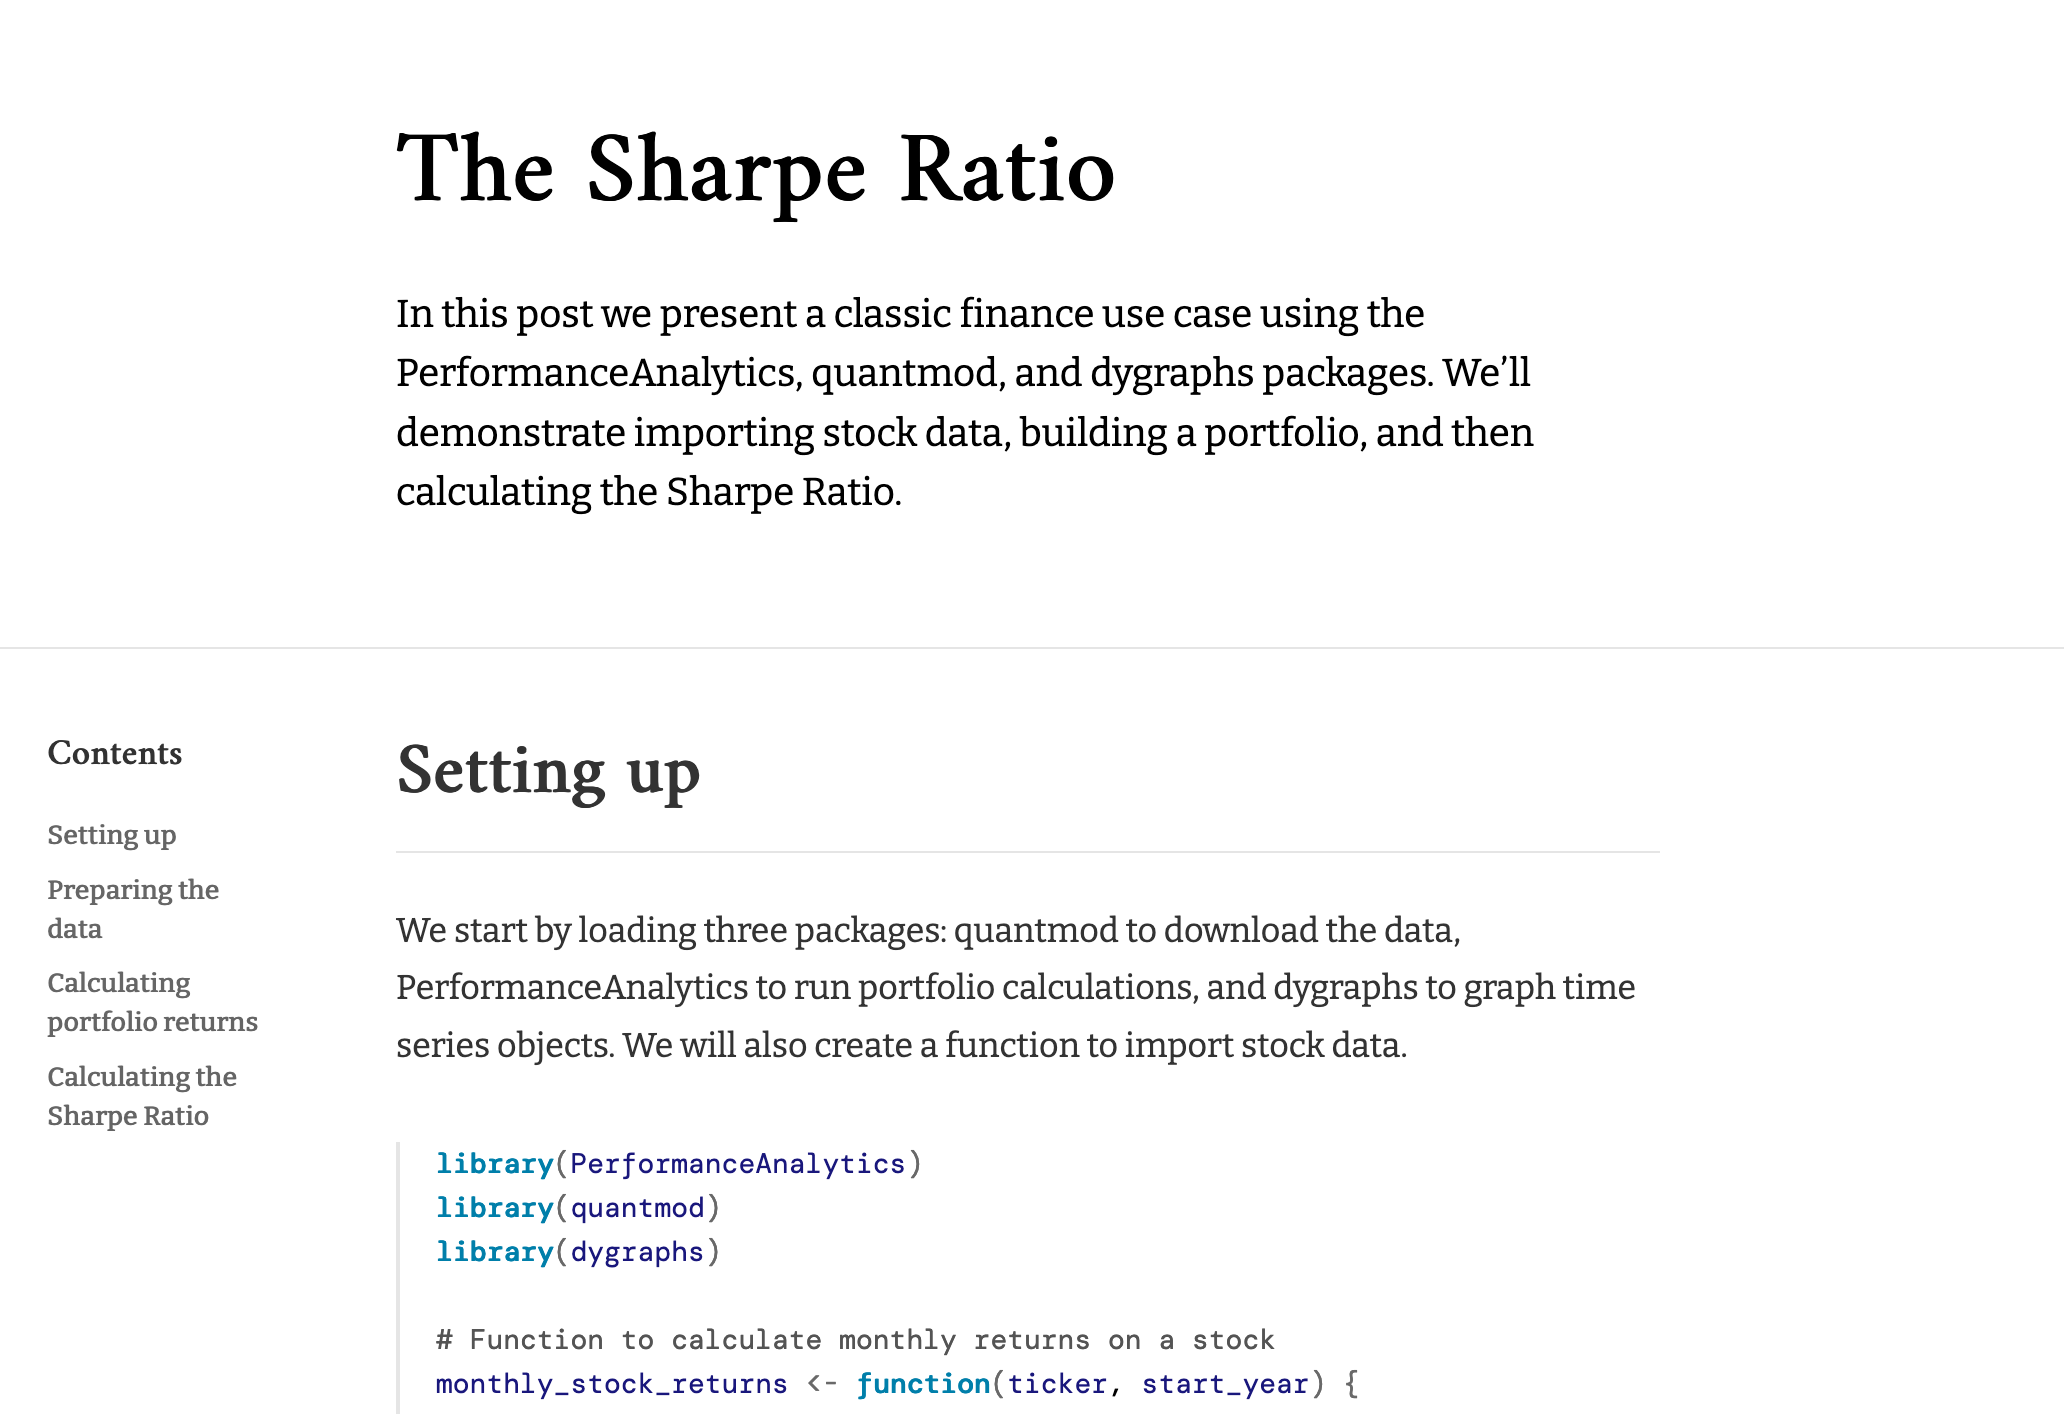
create_theme(name = "theme") Read more about how to customize a Distill theme. To apply a custom theme to an article, add a theme key to your article’s YAML front-matter:
---
title: "The Sharpe Ratio"
output:
  distill::distill_article:
    toc: true
    theme: theme.css
---
One of the fastest ways to change the default appearance is to use custom Google fonts. To do this, you need to do two things:
Embed the font using the @import method, and
Specify the font in the CSS file.
You can do both of these things inside your theme.css file. For example, here is an article styled with the demo theme detailed here.

/* base variables */
/* Edit the CSS properties in this file to create a custom
   Distill theme. Only edit values in the right column
   for each row; values shown are the CSS defaults.
   To return any property to the default,
   you may set its value to: unset
   All rows must end with a semi-colon.                      */
/* Optional: embed custom fonts here with `@import`          */
/* This must remain at the top of this file.                 */
@import url('https://fonts.googleapis.com/css2?family=Amiri');
@import url('https://fonts.googleapis.com/css2?family=Bitter');
@import url('https://fonts.googleapis.com/css2?family=DM+Mono');
html {
  /*-- Main font sizes --*/
  --title-size:      50px;
  --body-size:       1.06rem;
  --code-size:       14px;
  --aside-size:      12px;
  --fig-cap-size:    13px;
  /*-- Main font colors --*/
  --title-color:     #000000;
  --header-color:    rgba(0, 0, 0, 0.8);
  --body-color:      rgba(0, 0, 0, 0.8);
  --aside-color:     rgba(0, 0, 0, 0.6);
  --fig-cap-color:   rgba(0, 0, 0, 0.6);
  /*-- Specify custom fonts ~~~ must be imported above   --*/
  --heading-font:    "Amiri", serif;
  --mono-font:       "DM Mono", monospace;
  --body-font:       "Bitter", sans-serif;
  --navbar-font:     "Amiri", serif;
}
/* More properties ... */
Acknowledgments
Taken from the original source
Distill for R Markdown builds on the work of many individuals and projects. Shan Carter, Ludwig Schubert, and Christopher Olah created the Distill web framework. John MacFarlane created the Pandoc universal markup converter. Davide Cervone and Volker Sorge created the MathJax library for rendering mathematical notation on the web. Mike Bostock created the D3 library for producing dynamic, interactive data visualizations for the web. We are grateful for the spirit of generosity that moved these individuals to create high-quality open source software for the benefit of all.
Disclaimer
This content was inspired by and duplicated under CC BY 4.0:
Allaire, et al. (2018, Sept. 10). Distill for R Markdown. Retrieved from https://rstudio.github.io/distillMuch of the content was modified either completely or slightly to condense the material and to utilize different data, however some content was duplicated completely.
This will become a hover-able footnote↩︎