DSF 2022: Statistics
October 25, 2022
Statistics

Why do we need statistics?
- Proper methods
- Correct analysis
- Effectively present results
Statistics
Why do we need statistics?
- Proper methods
- Correct analysis
- Effectively present results?..
Road Map
Data and Sampling
Distributions
Central Limit Theorem
Statistical Significance & Power
Hypothesis Testing
Road Map
Data and Sampling
Distributions
Central Limit Theorem
Statistical Significance & Power
Hypothesis Testing

Case Study
Objective: Evaluate the effectiveness of cognitive-behavior therapy for chronic fatigue syndrome.
Participant pool: 142 patients recruited from referrals by primary care physicians and consultants to a clinic that specializes in chronic fatigue syndrome.
Actual participants (N): 60 of 142 patients entered the study, some were excluded for various reasons and others refused to participate
Case Study: Results
Distribution of patients with good outcomes at 6-month follow-up. 7 patients dropped out of the study: 3 from treatment, 4 from control.
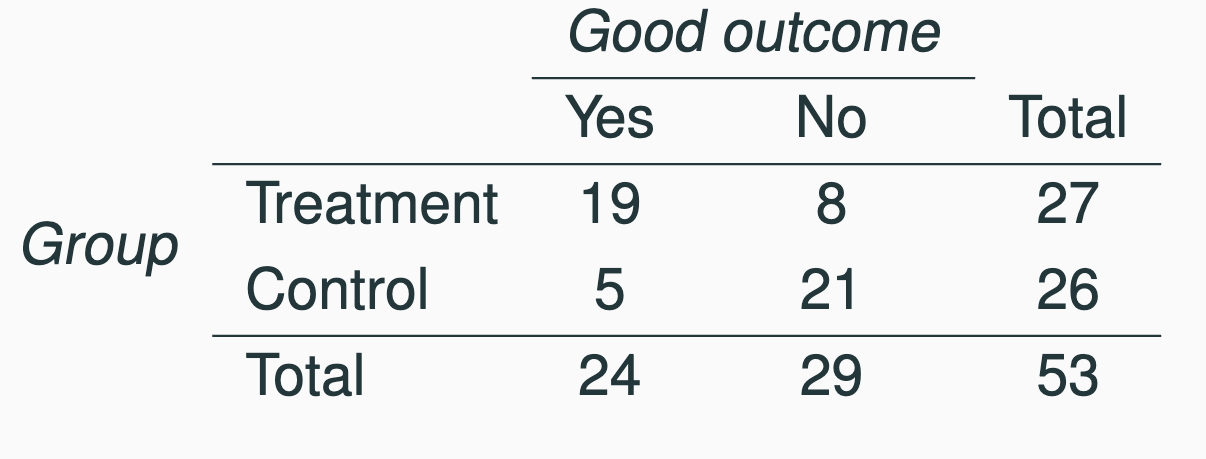
- Good outcomes in treatment: \(19/27 \approx 0.70 \to 70%\)
- Good outcomes in control group: \(5/26 \approx 0.19 \to 19\)
Conclusion?
Are the results generalizable to all with chronic fatigue syndrome?
- Only volunteers with specific characteristics
- Not generalizable, but the results are encouraging
- What next?
Data Types

Data Types

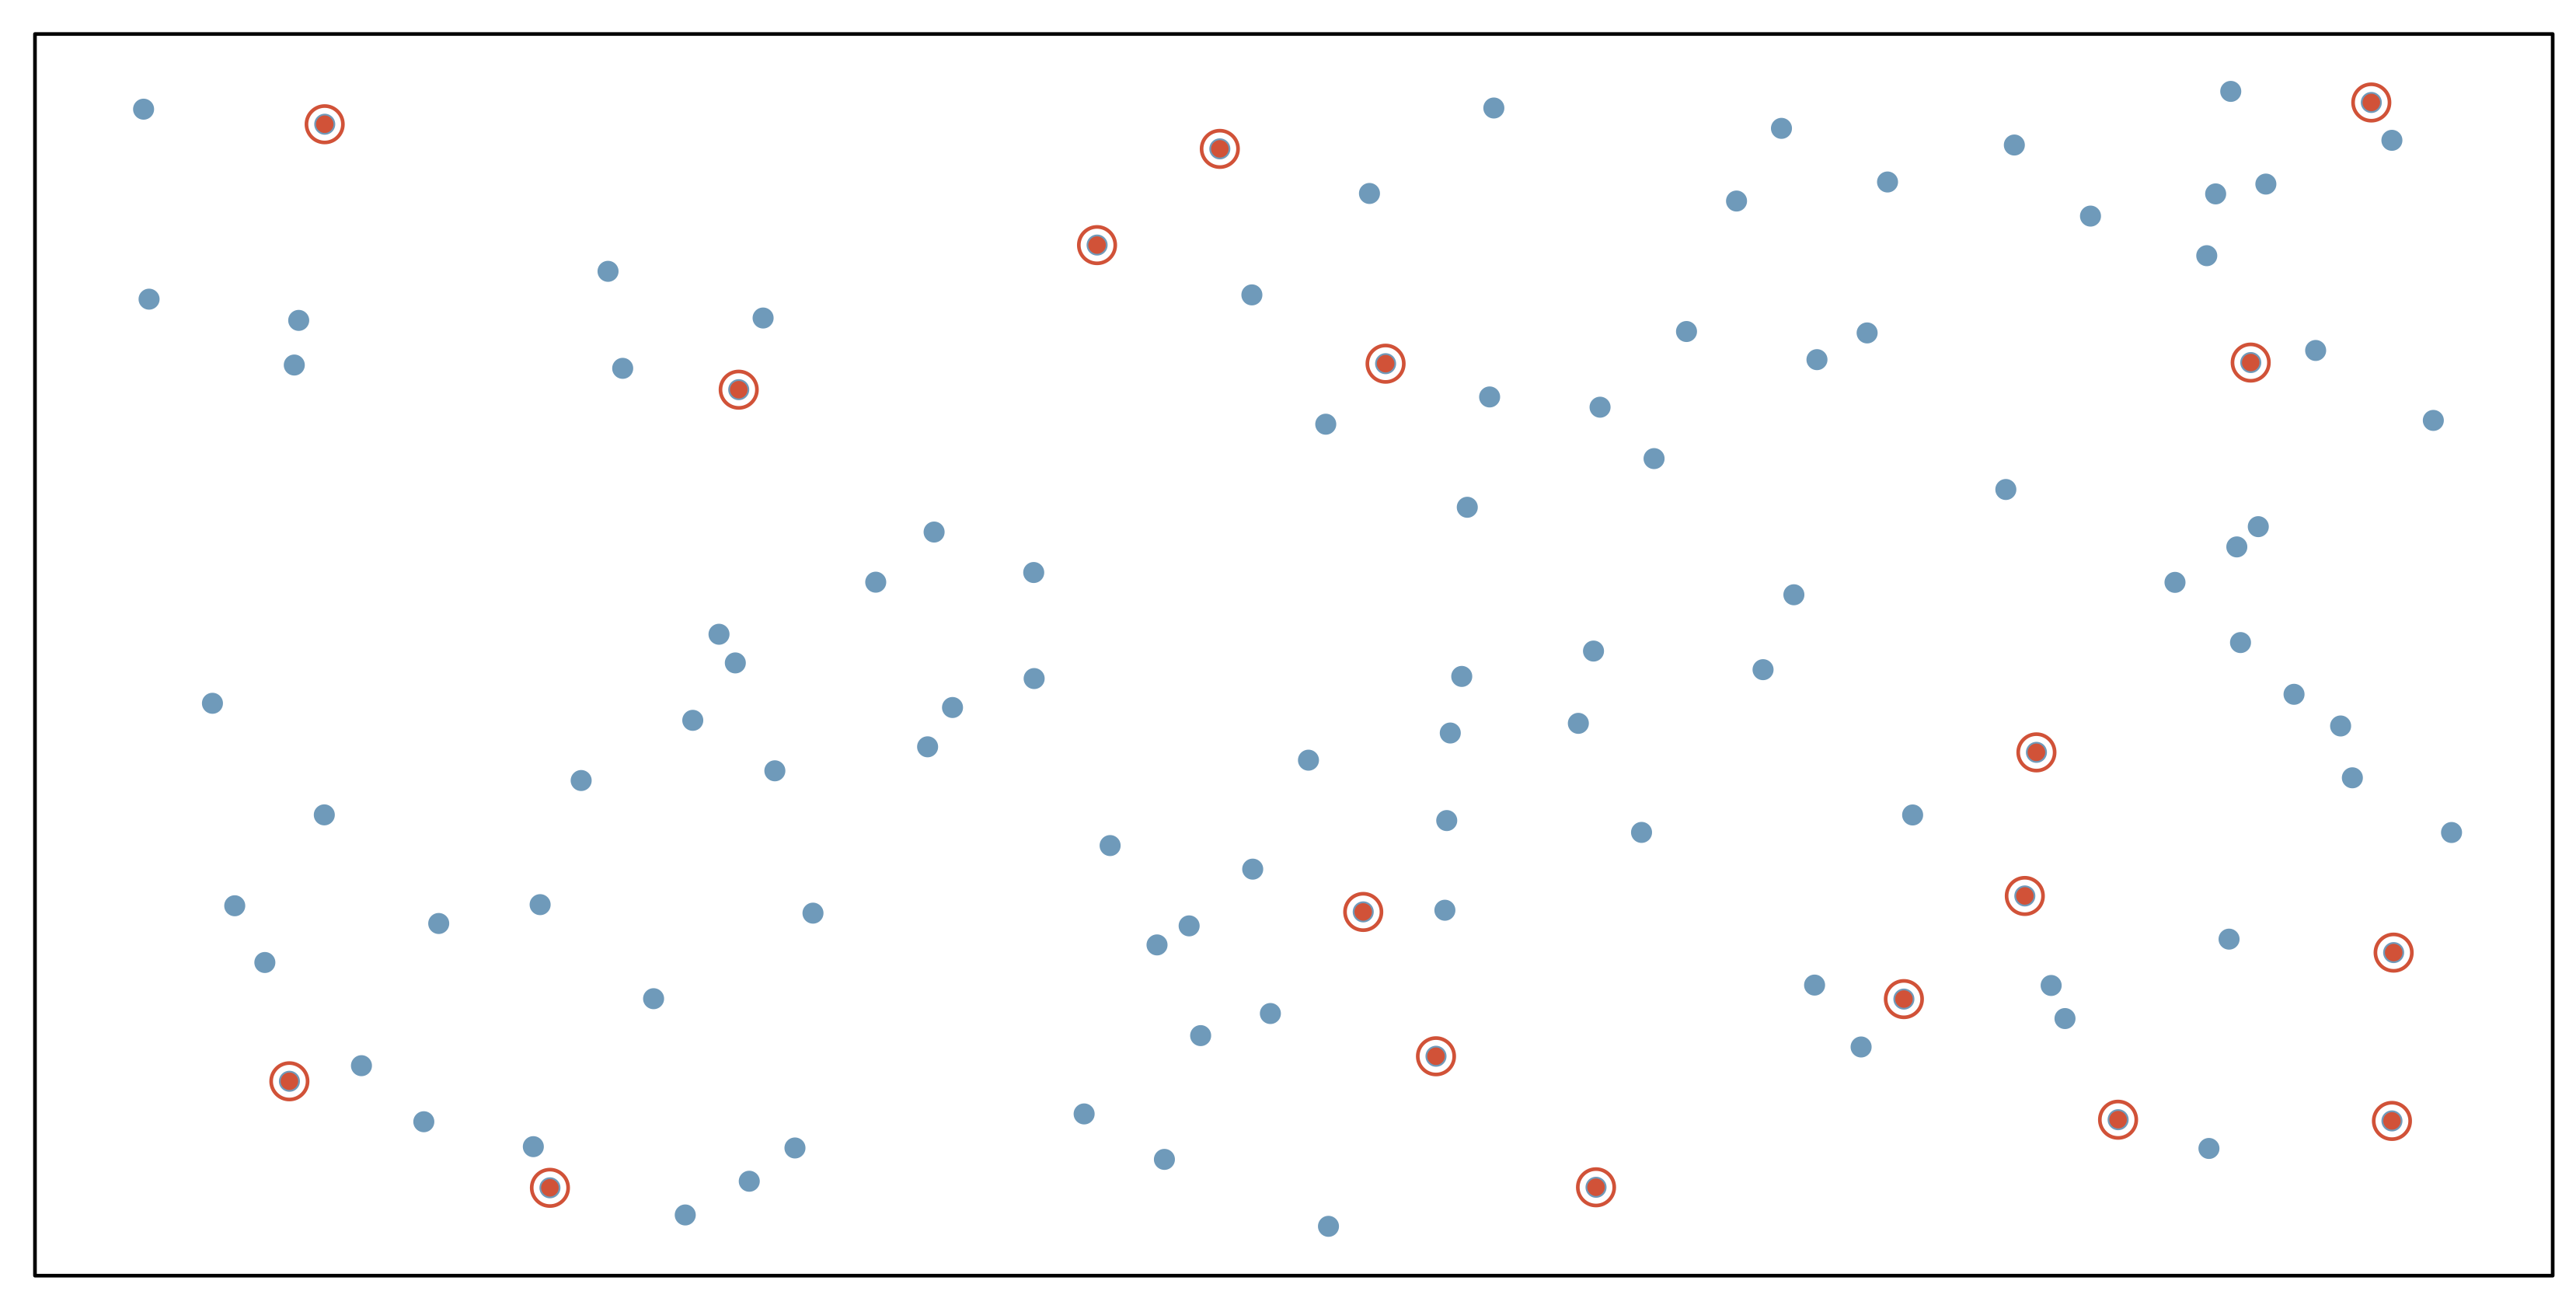
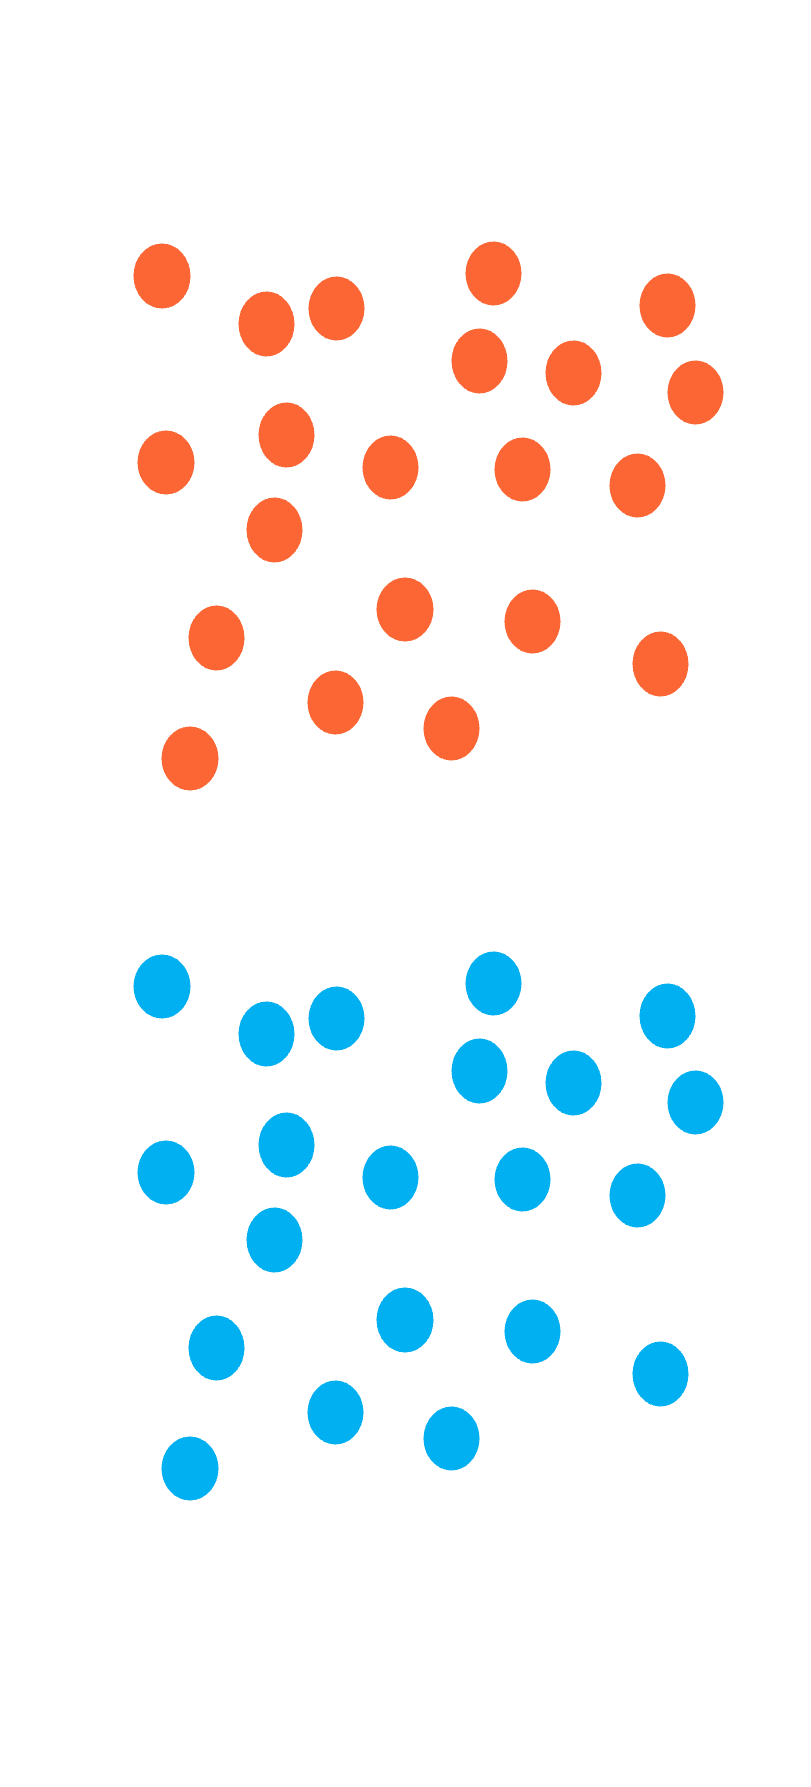
Sampling: Simple random
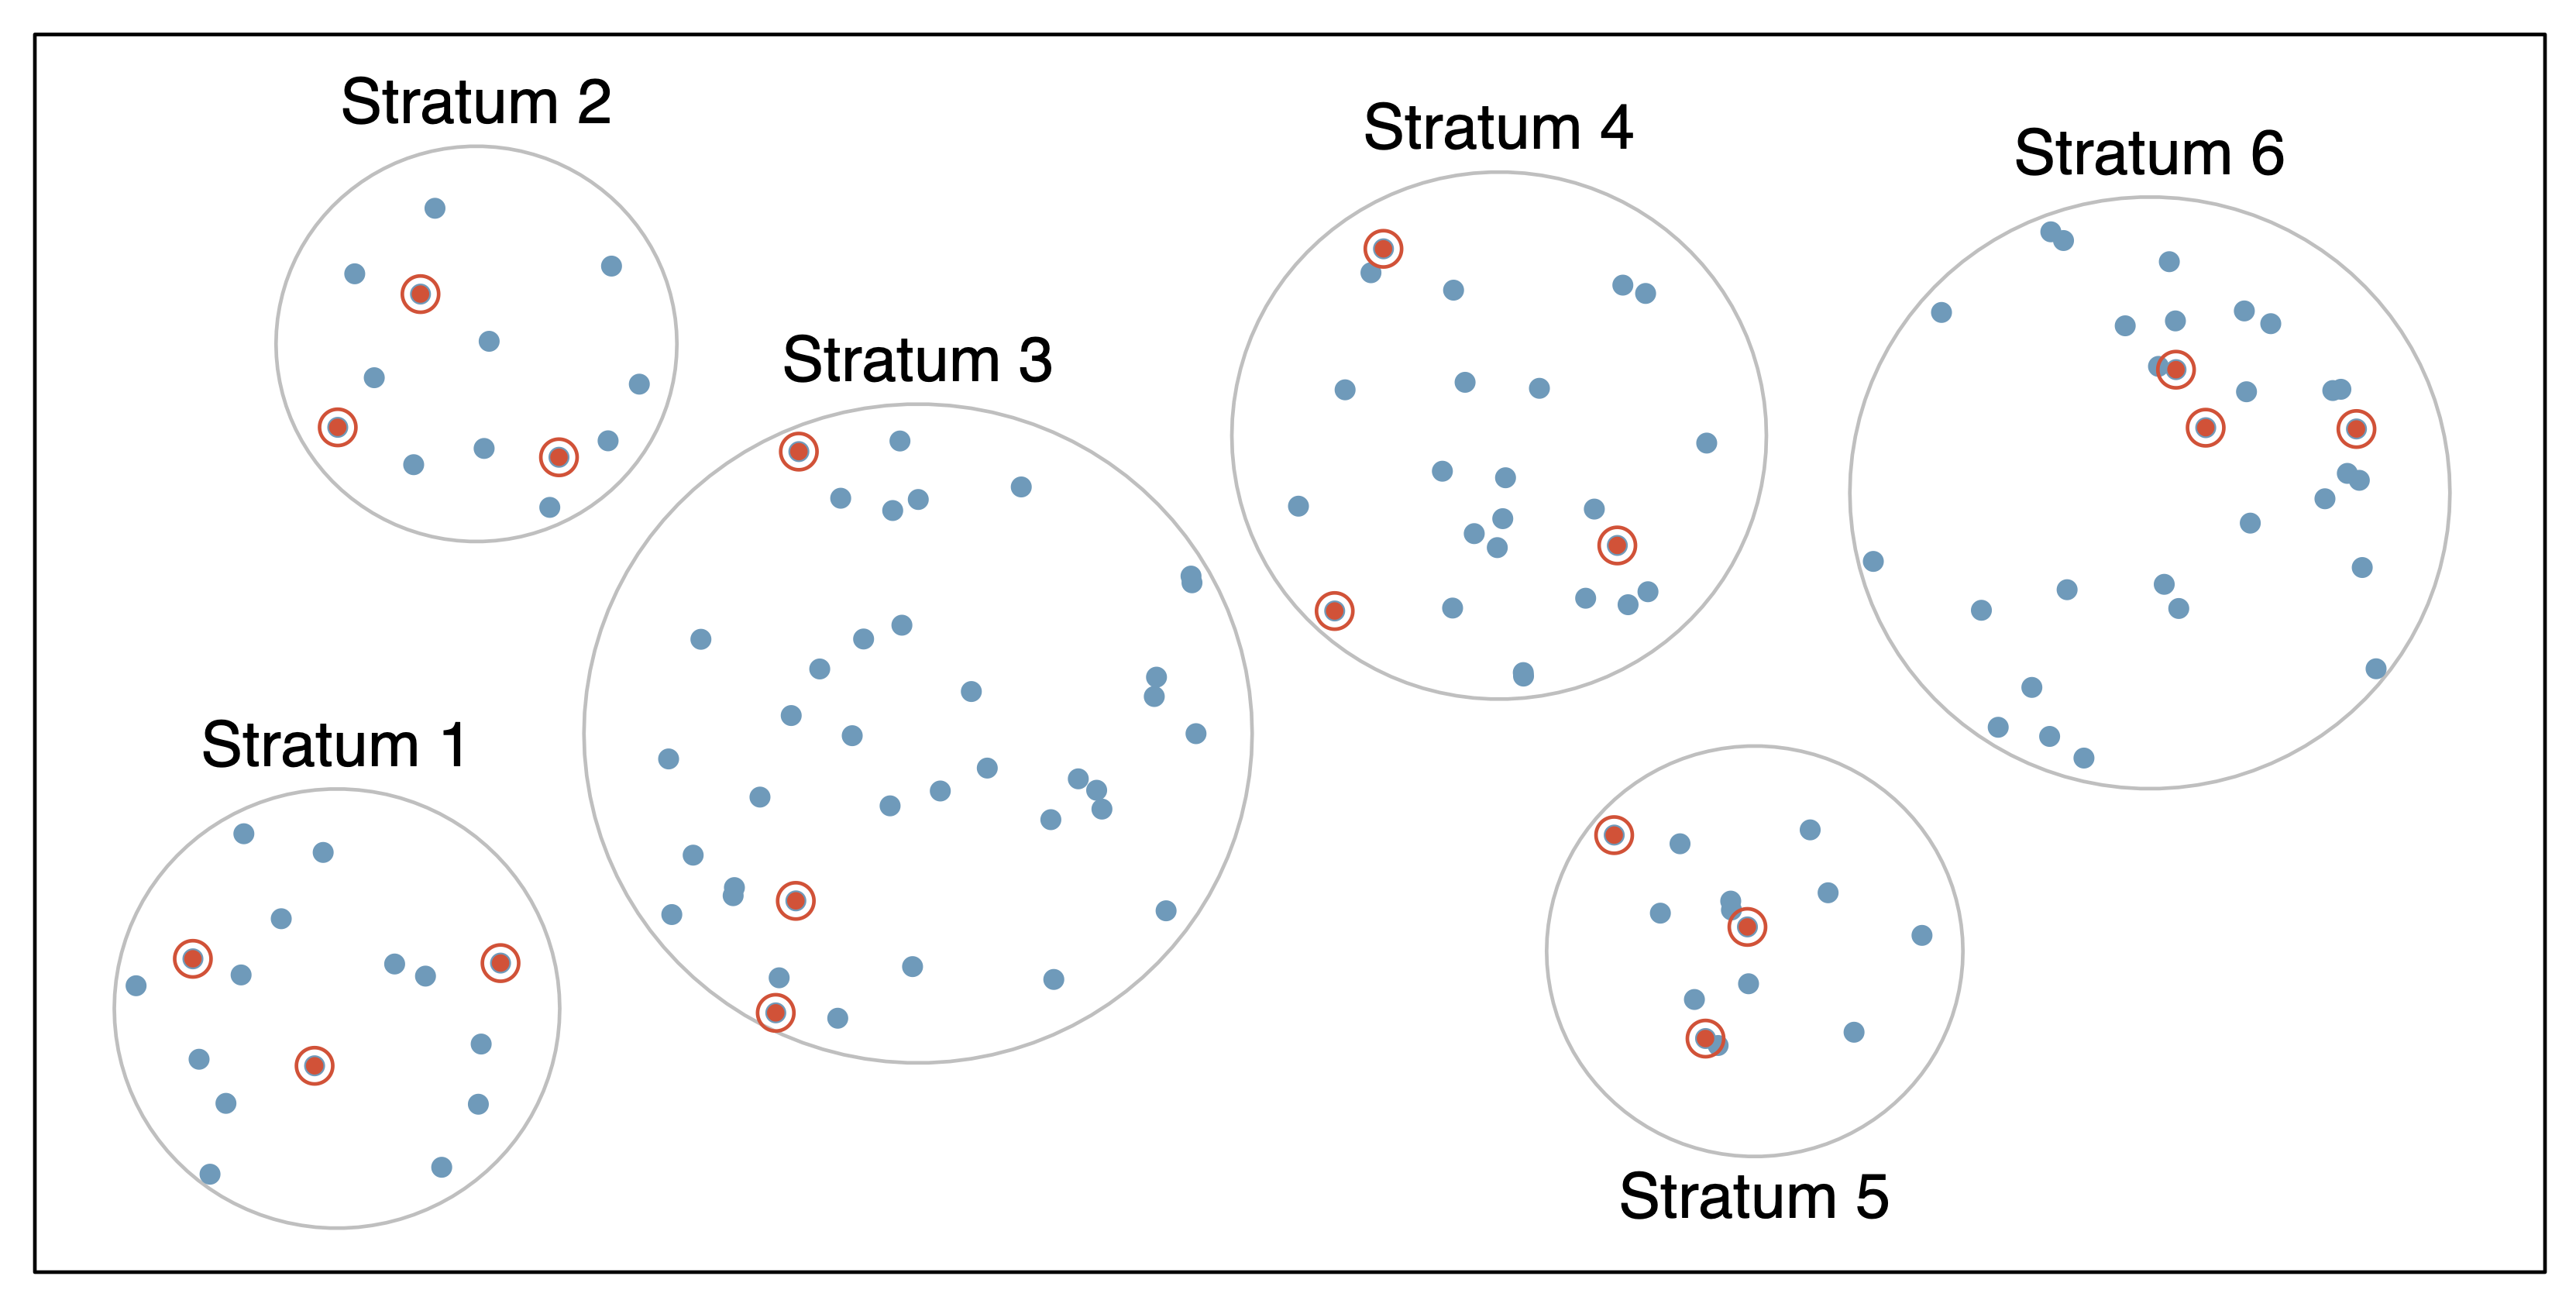
Sampling: Stratified
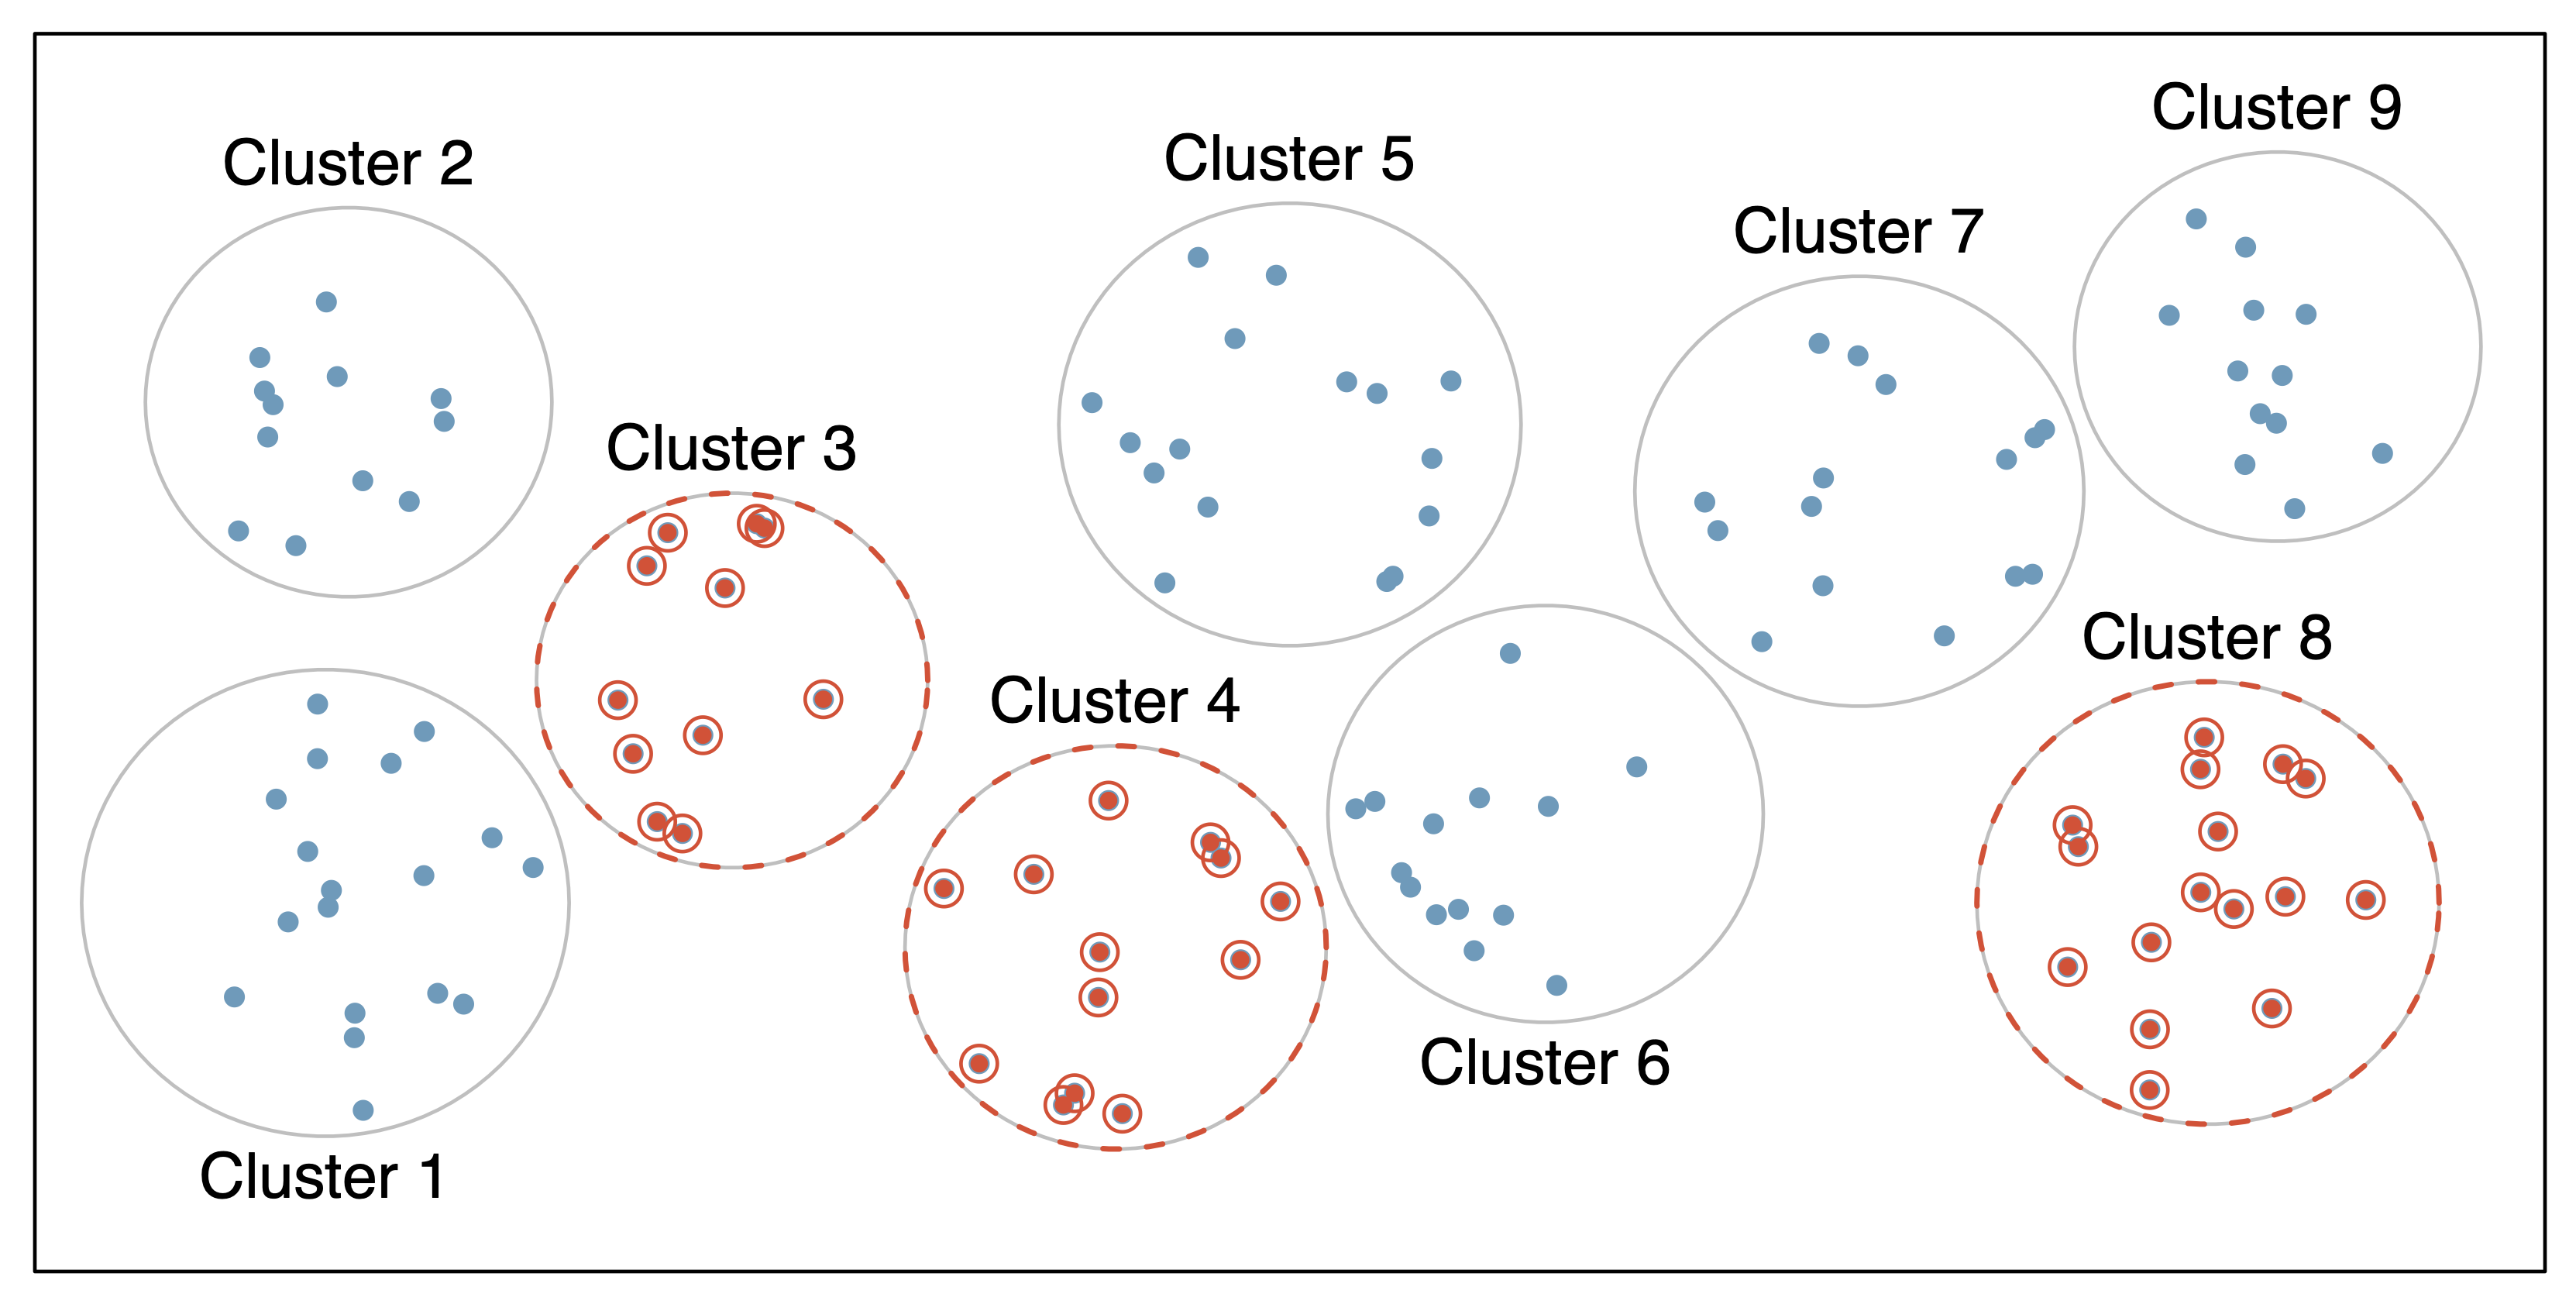
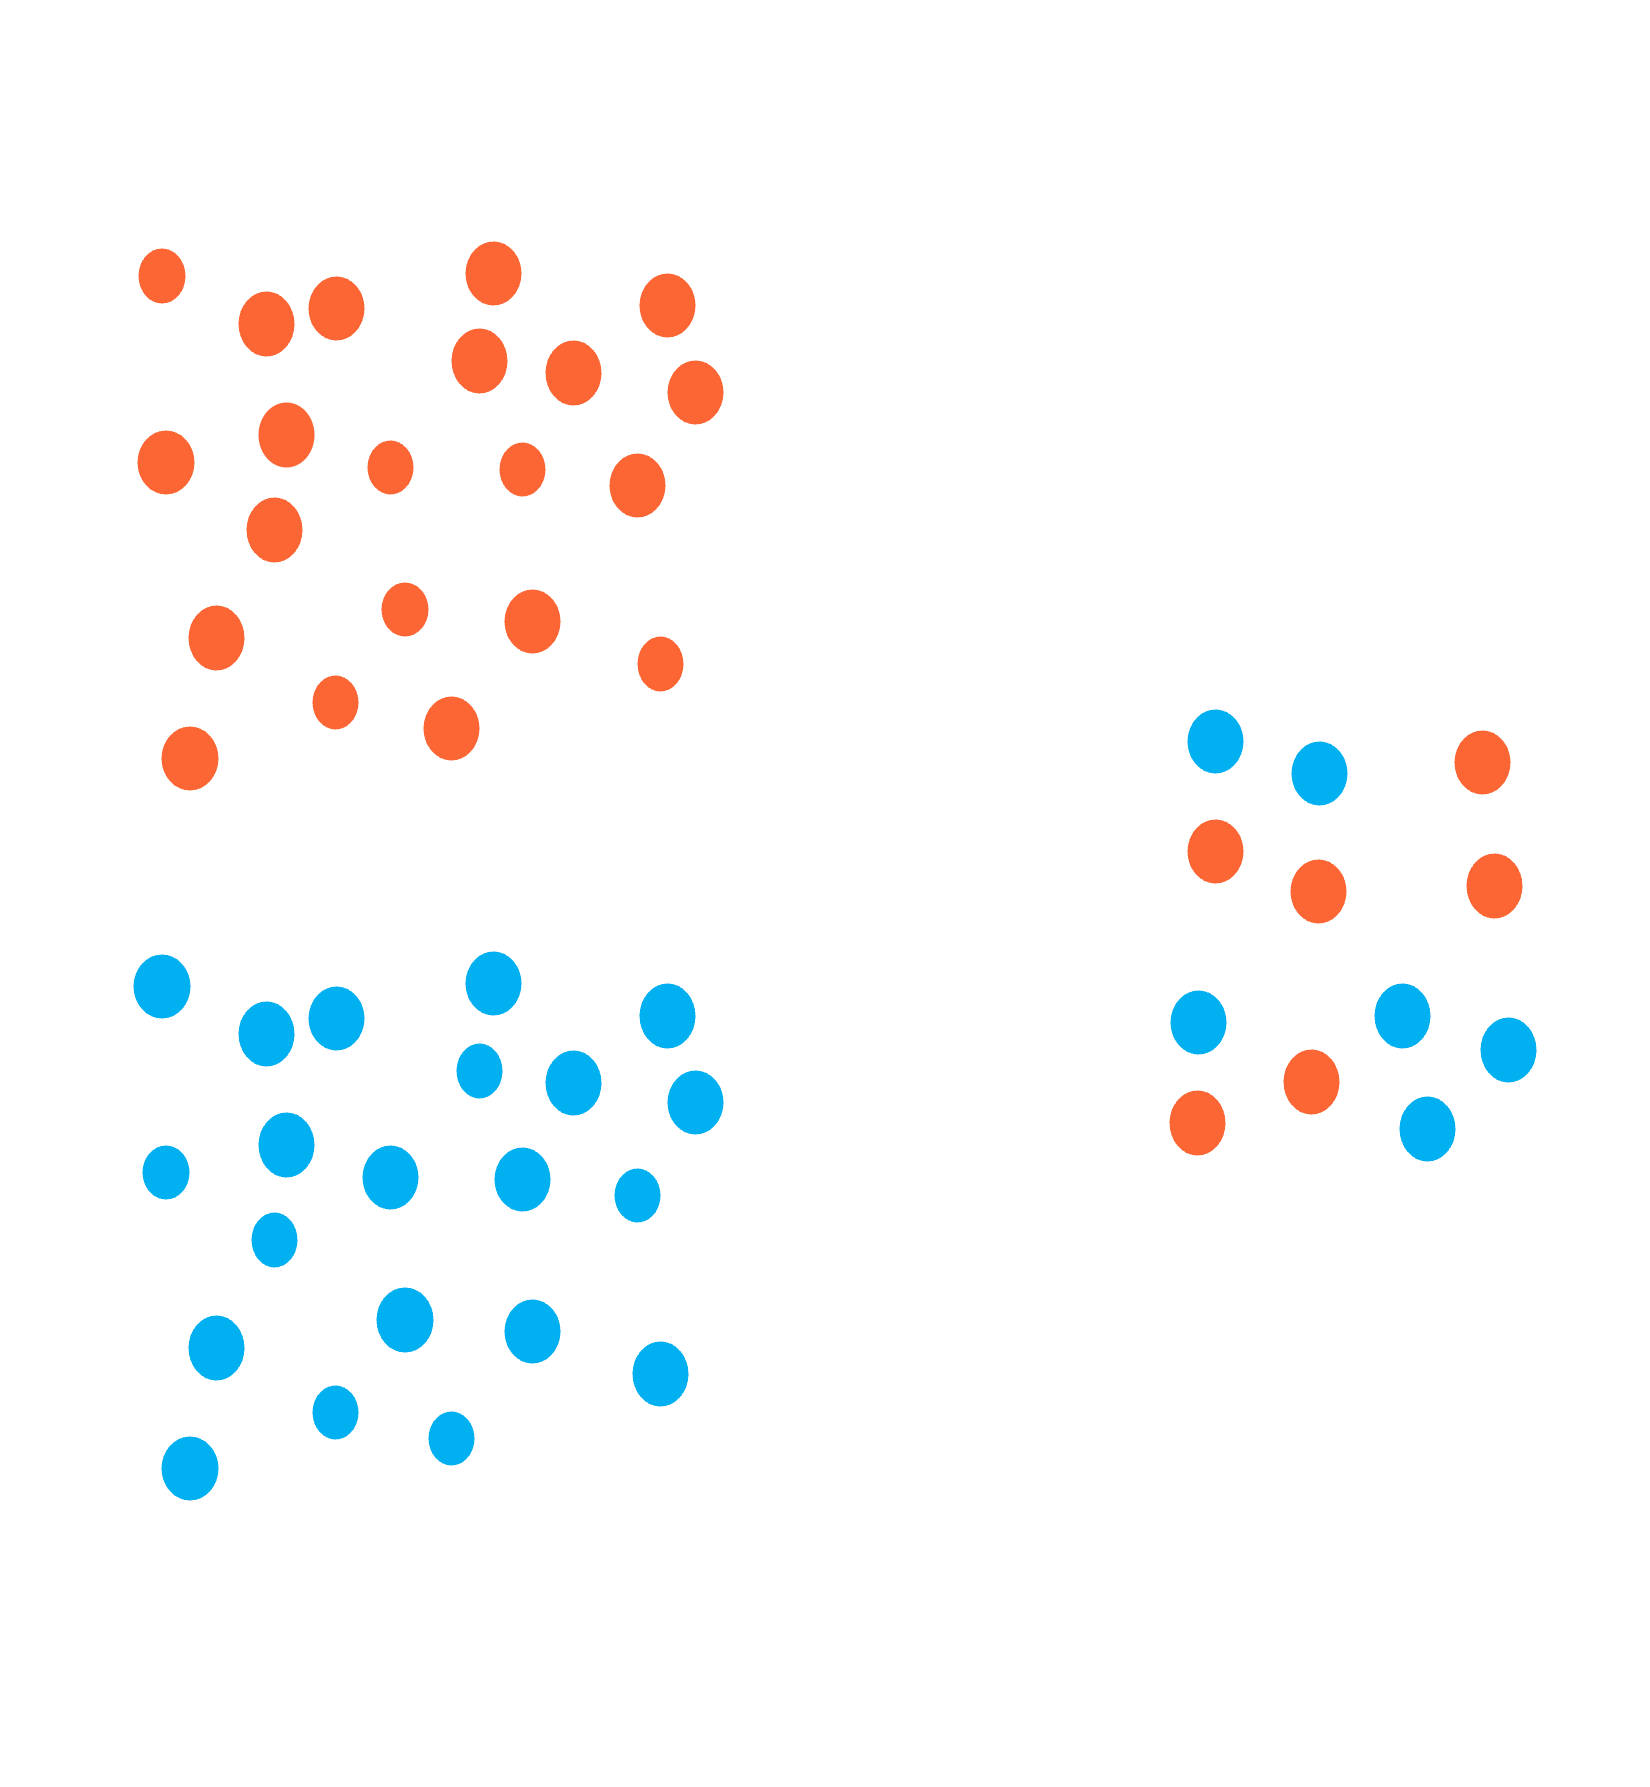
Sampling: Clustered
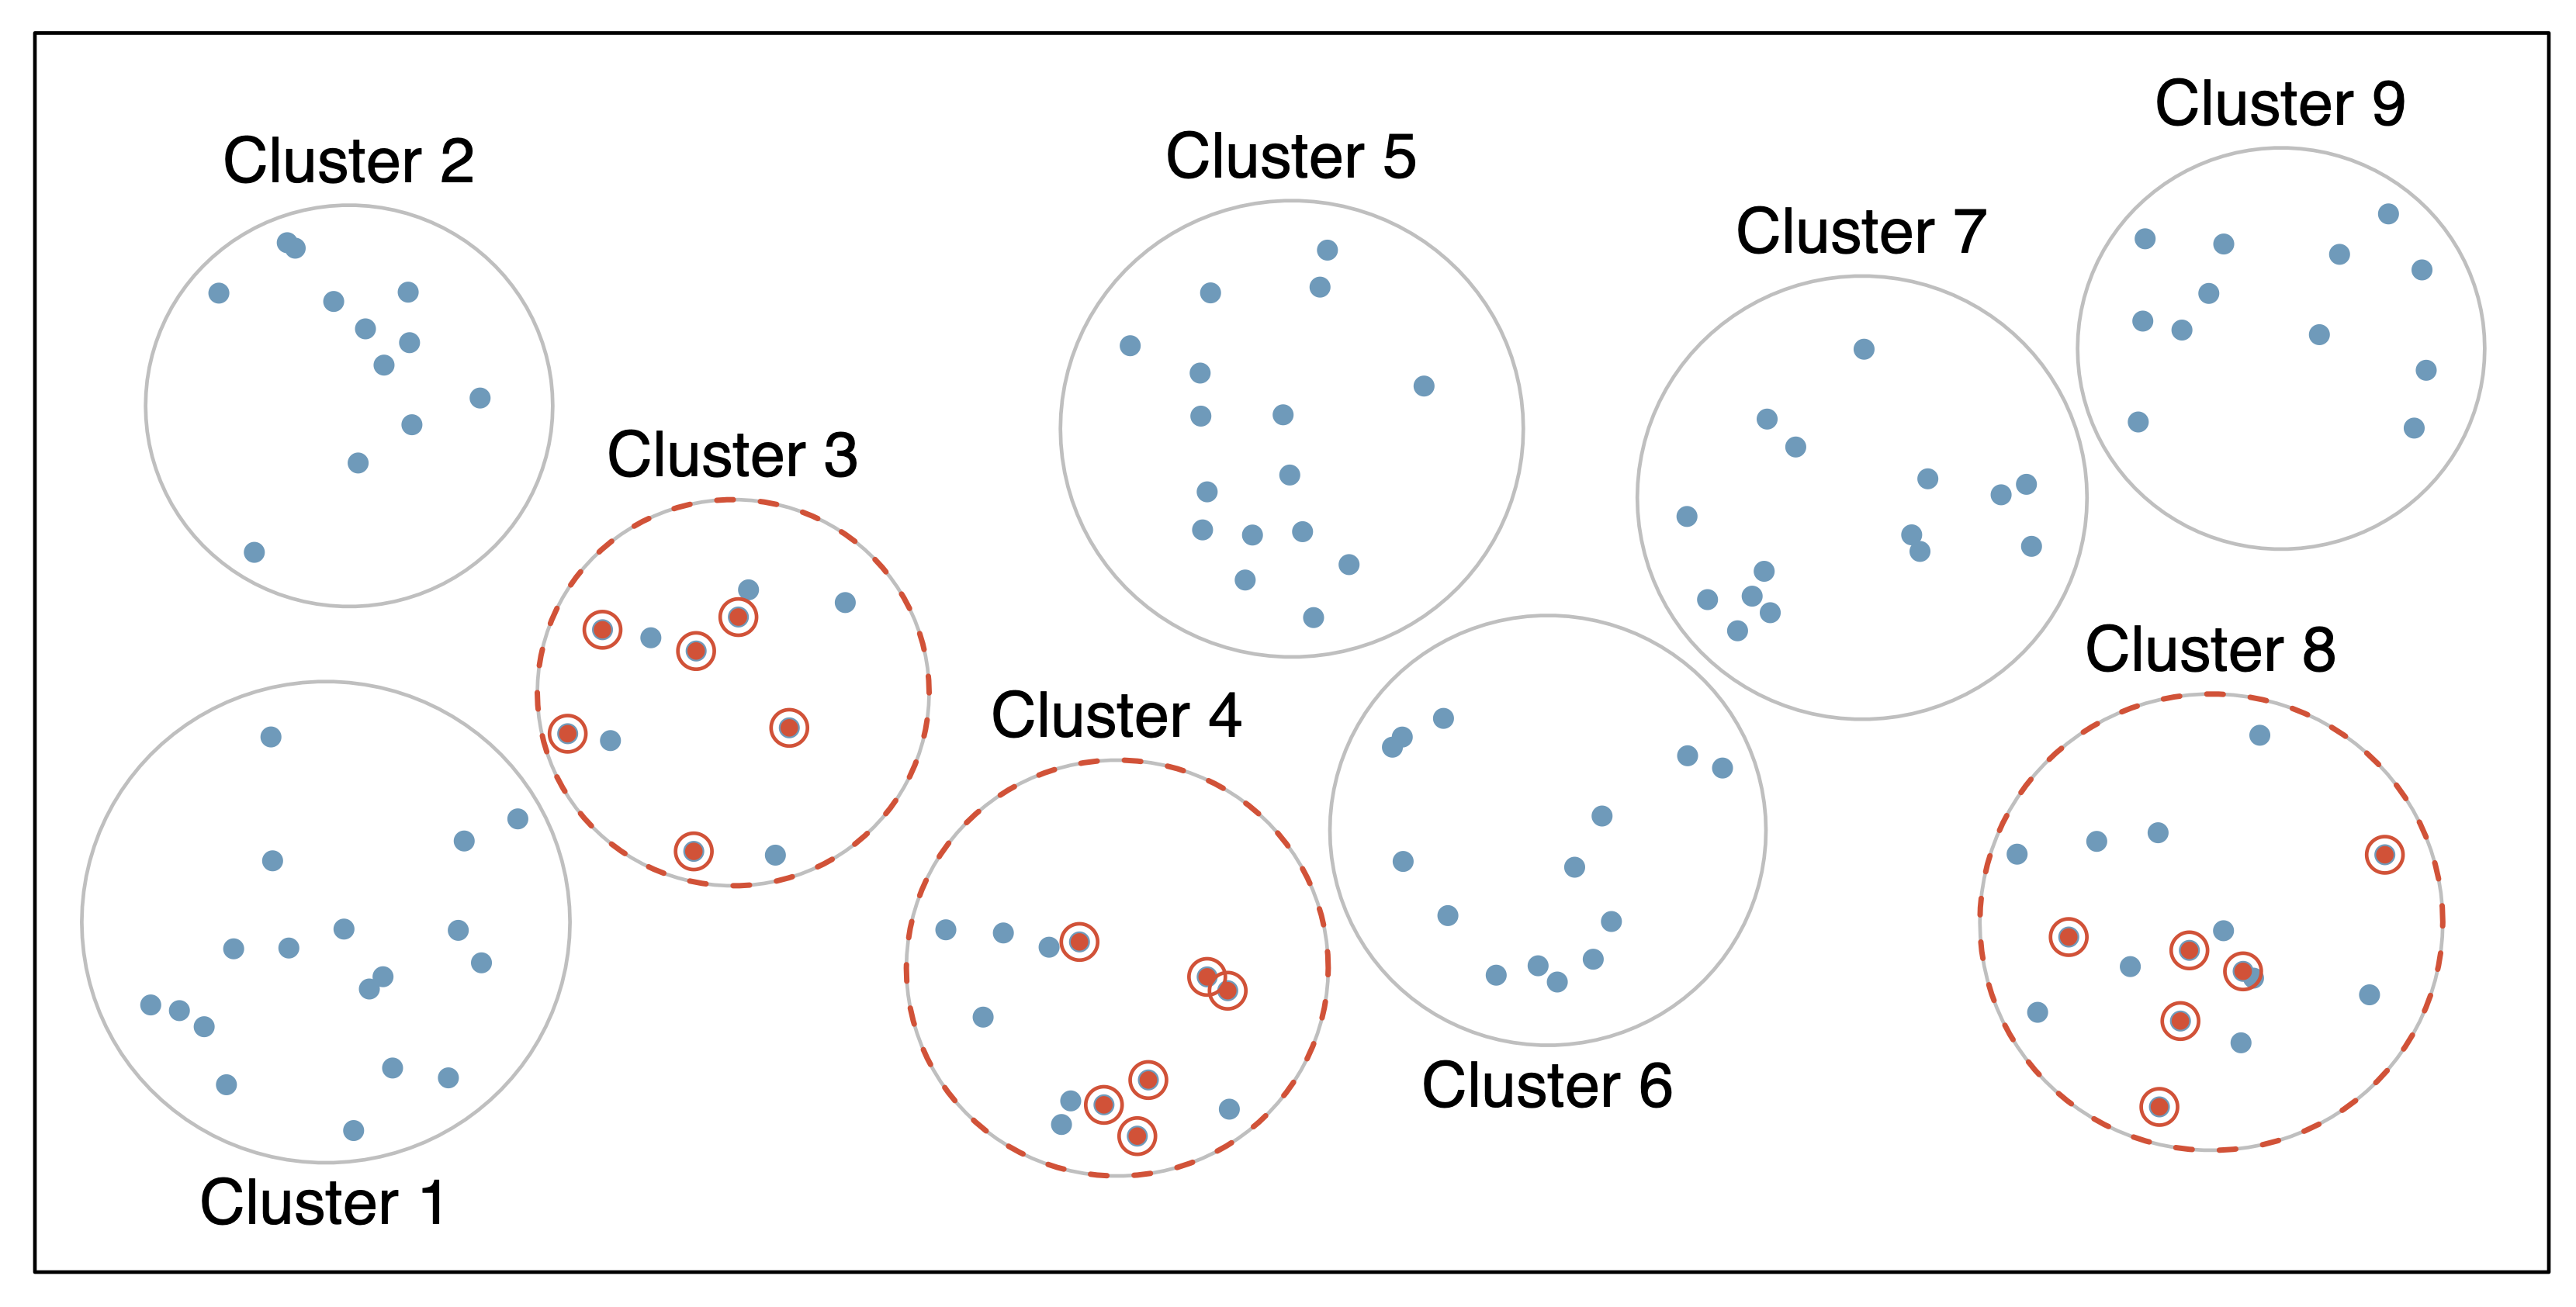
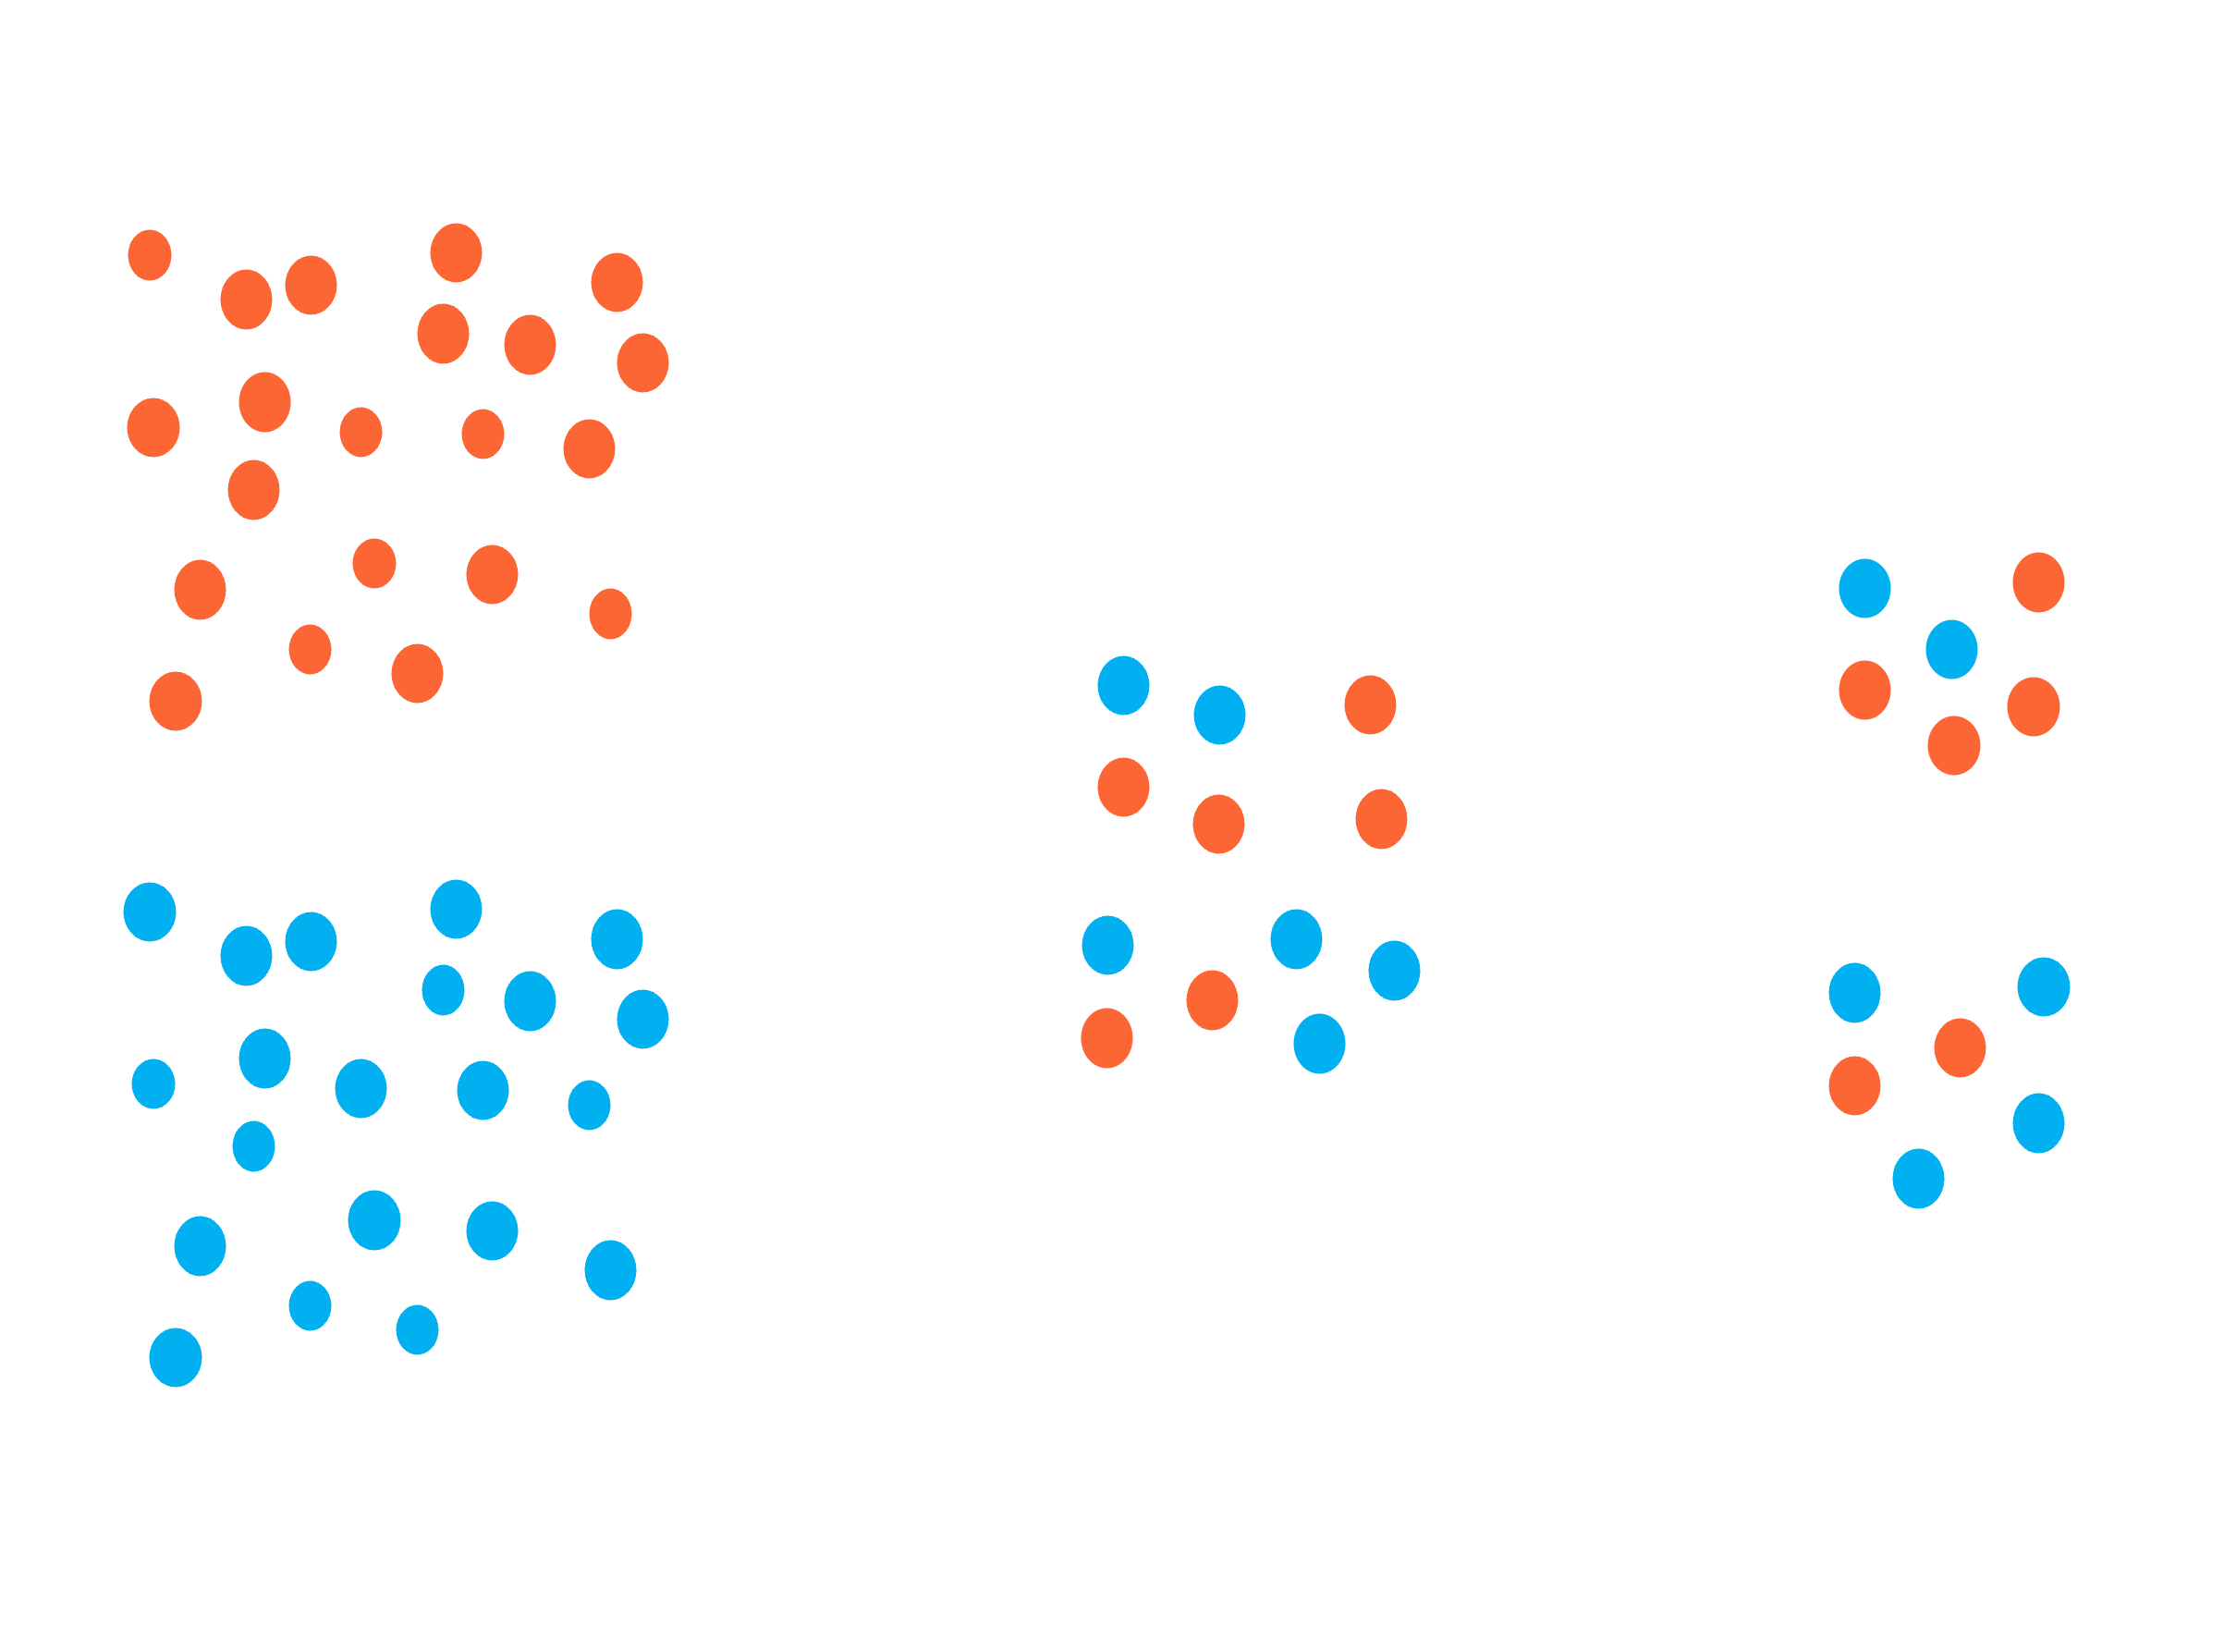
Sampling: Multistaged
Sampling vs. Selection
Sampling vs. Selection
Sampling vs. Selection
Types of Variables
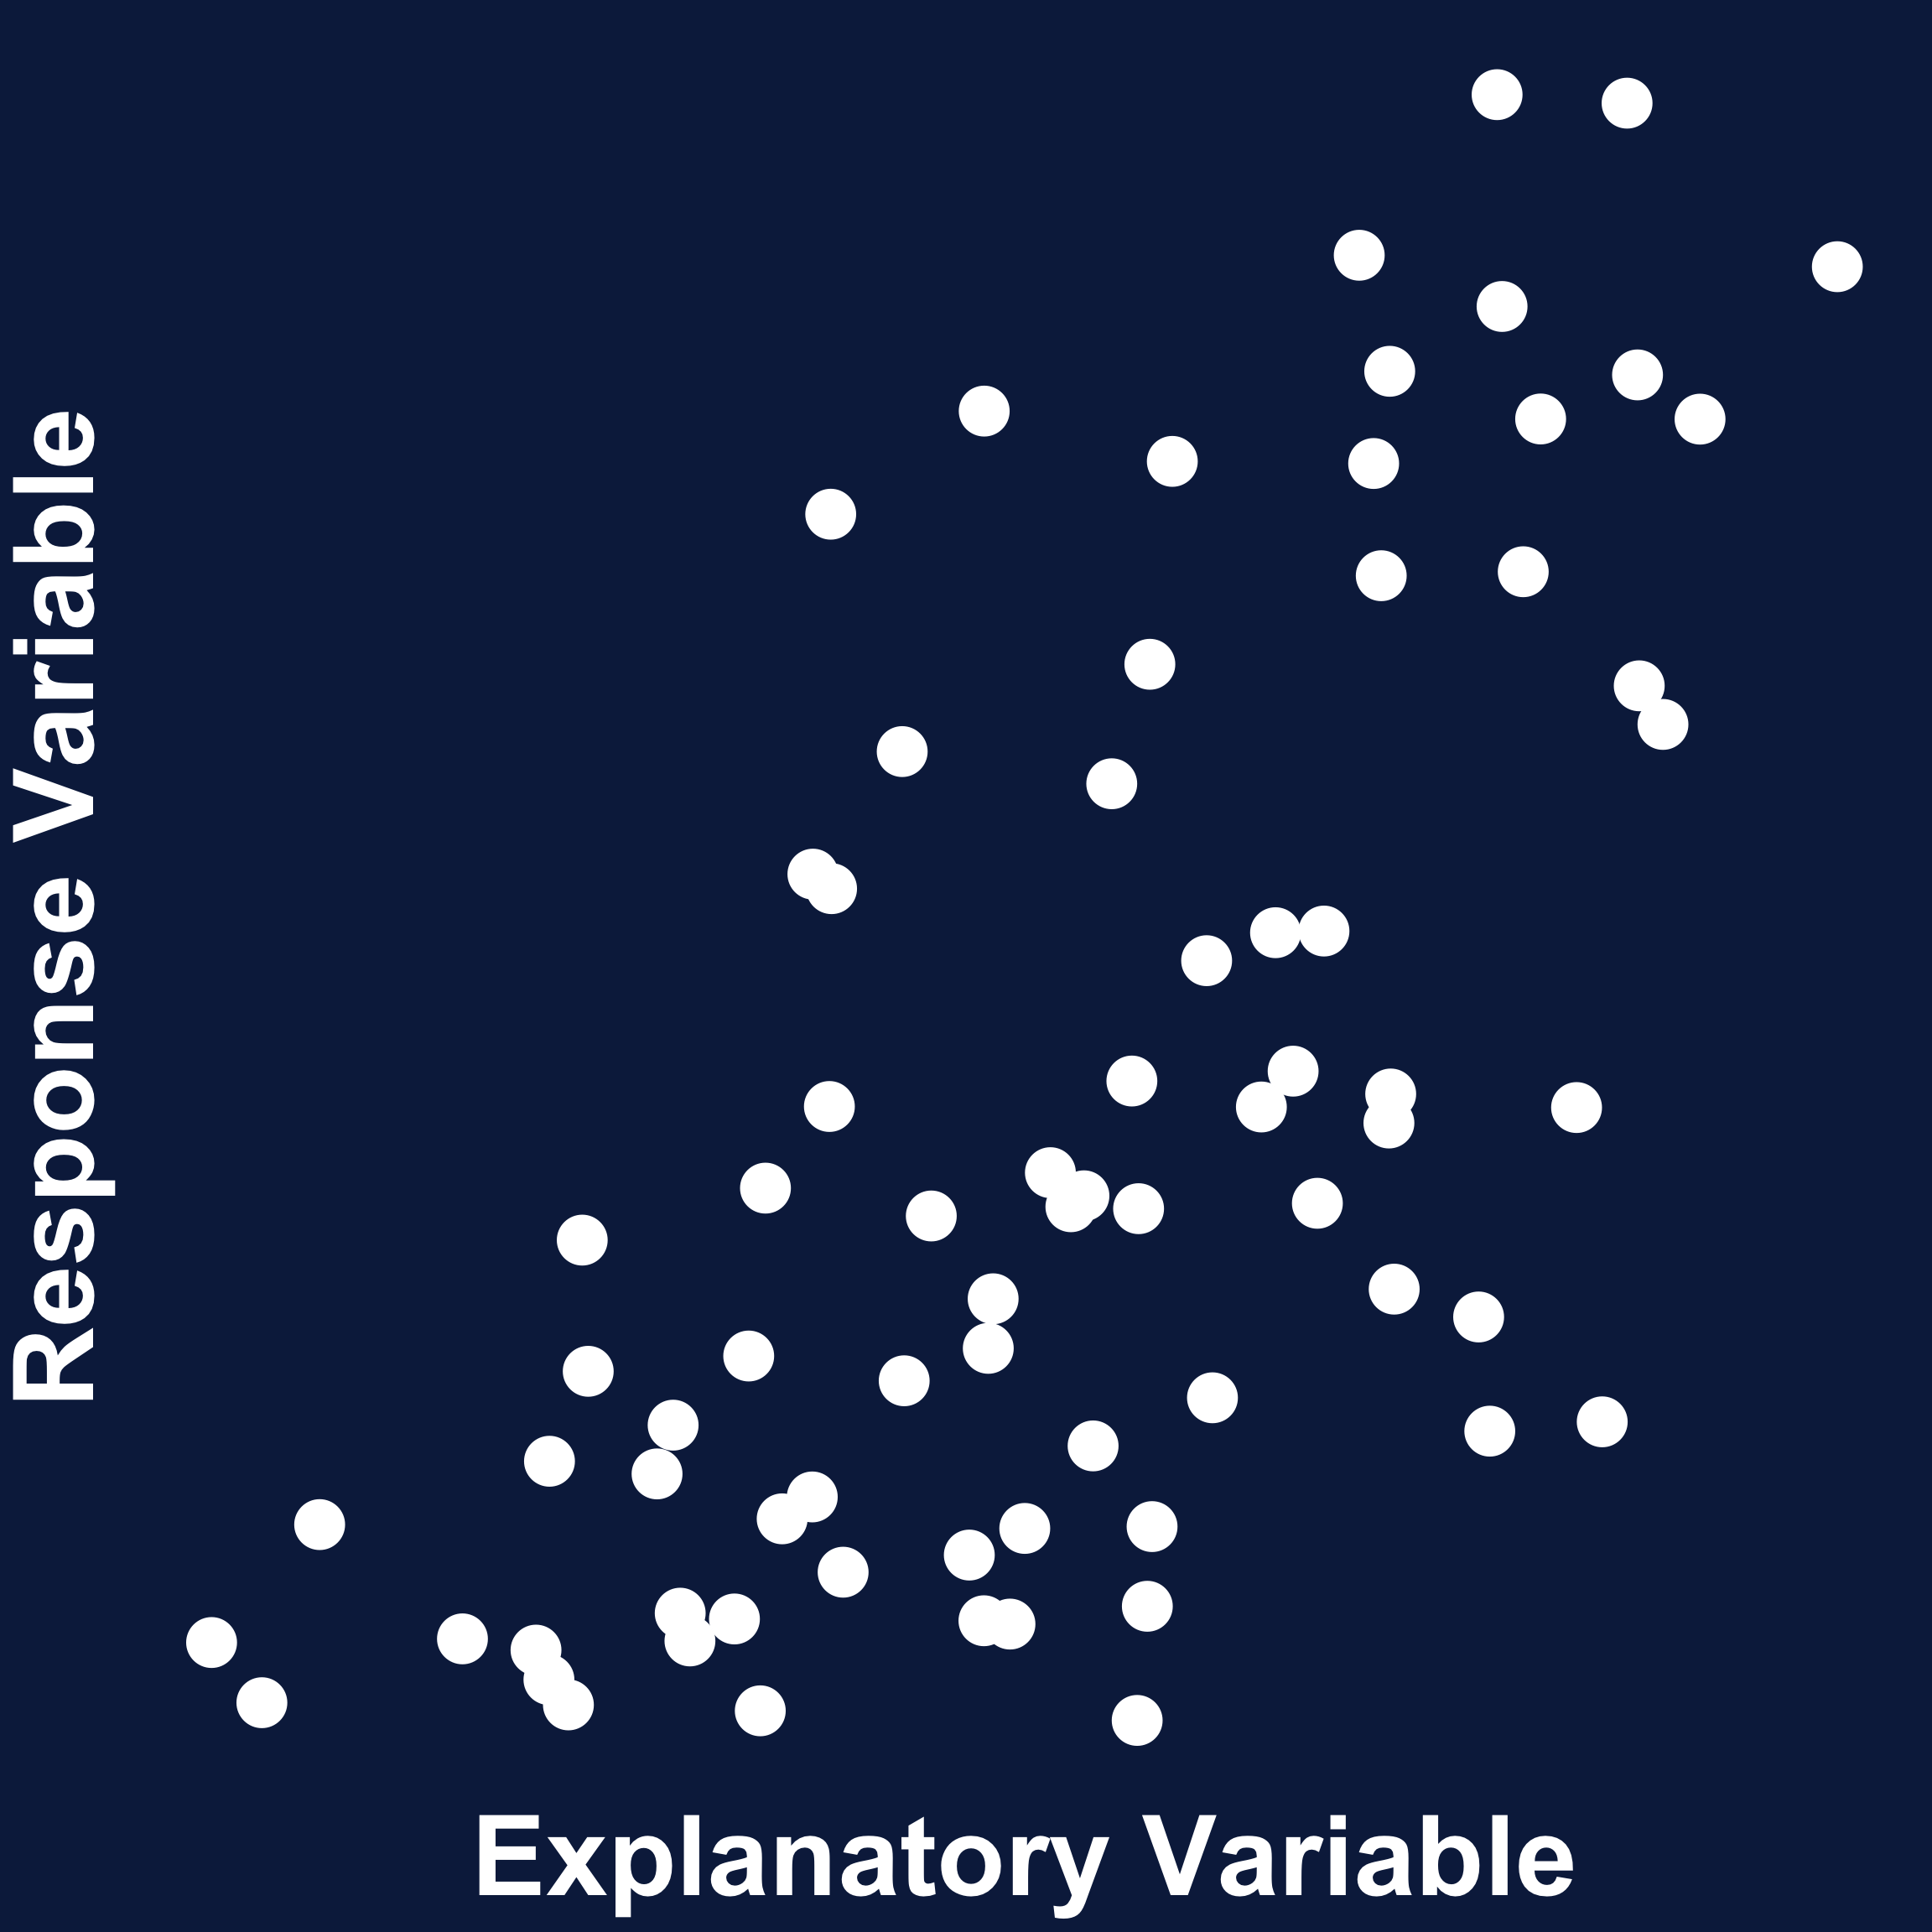
- Response variable: variable that is predicted by another
- Explanatory variable: variable that predicts the response variable
Road Map
Data and Sampling
Distributions
Central Limit Theorem
Statistical Significance & Power
Hypothesis Testing

Distributions: Gaussian
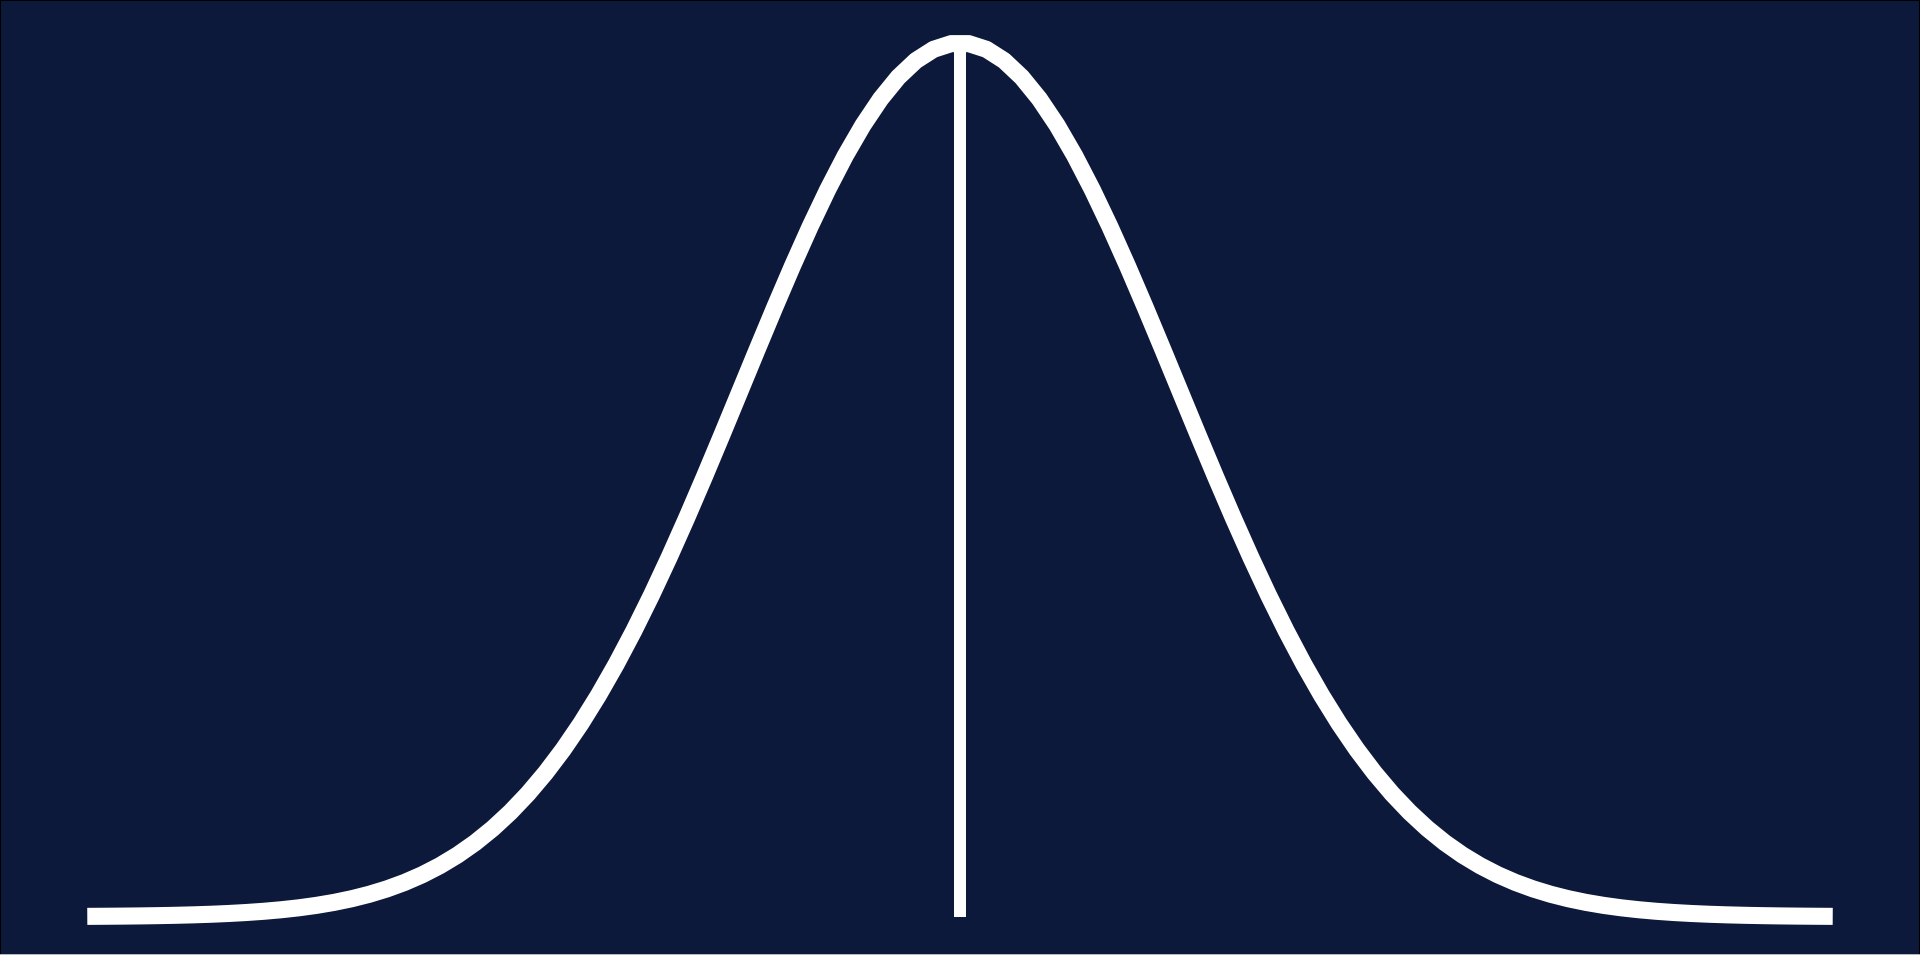
- Symmetrical
- Mean = Median
- No changes to data needed
Distributions: Skewed
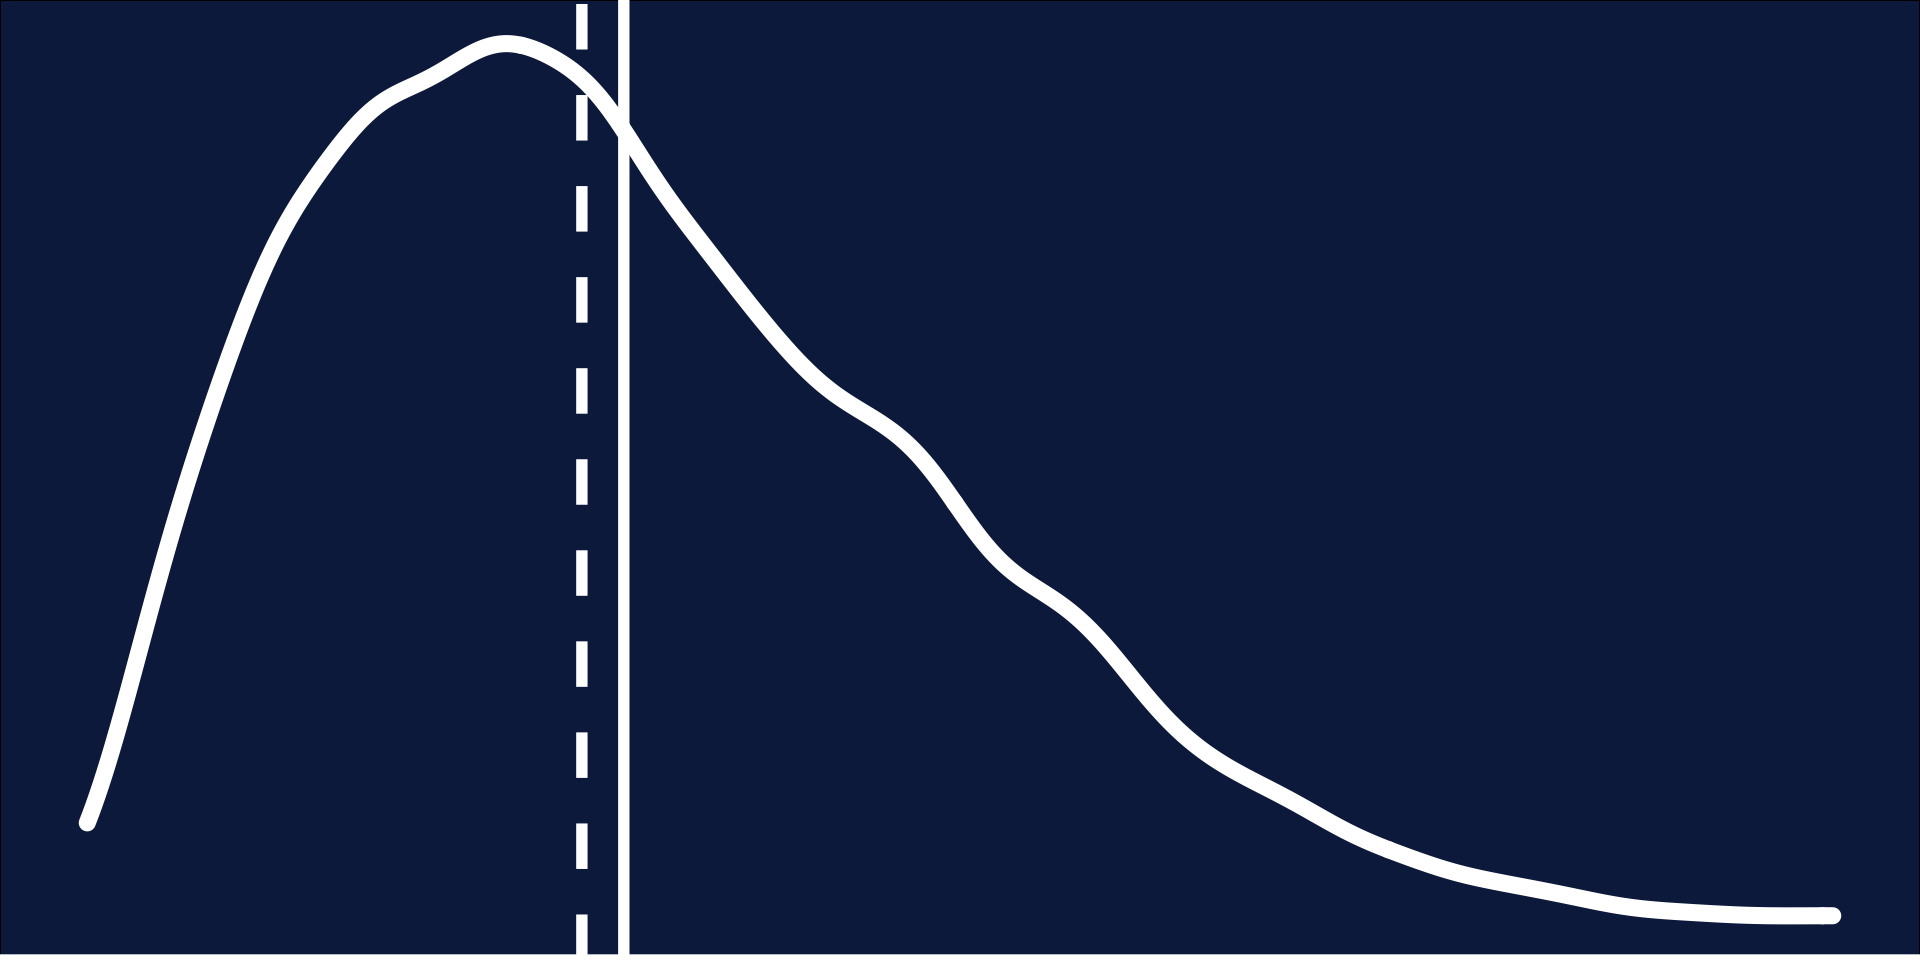
- Not symmetrical
- Mean = Median
- Transform data (e.g., square-root)
Distributions: Skewed
- Not symmetrical
- Mean = Median
- Transform data (e.g., square-root)
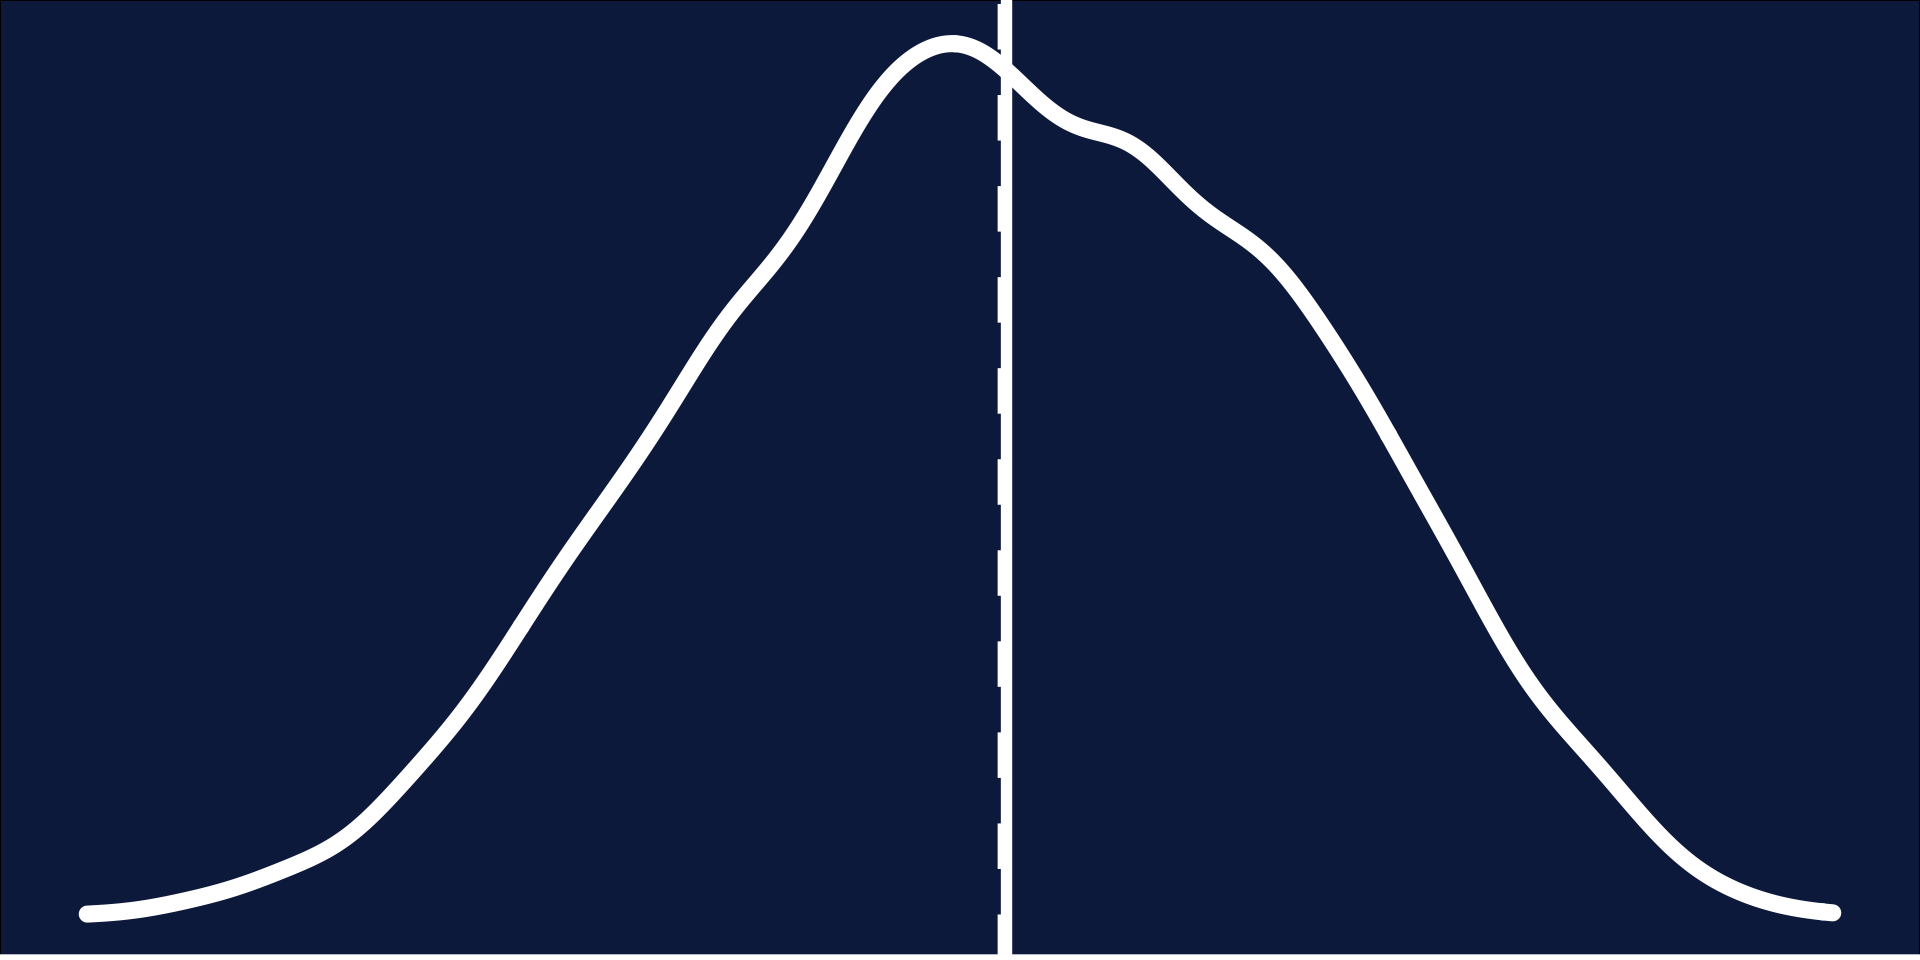
Distributions: Bimodal
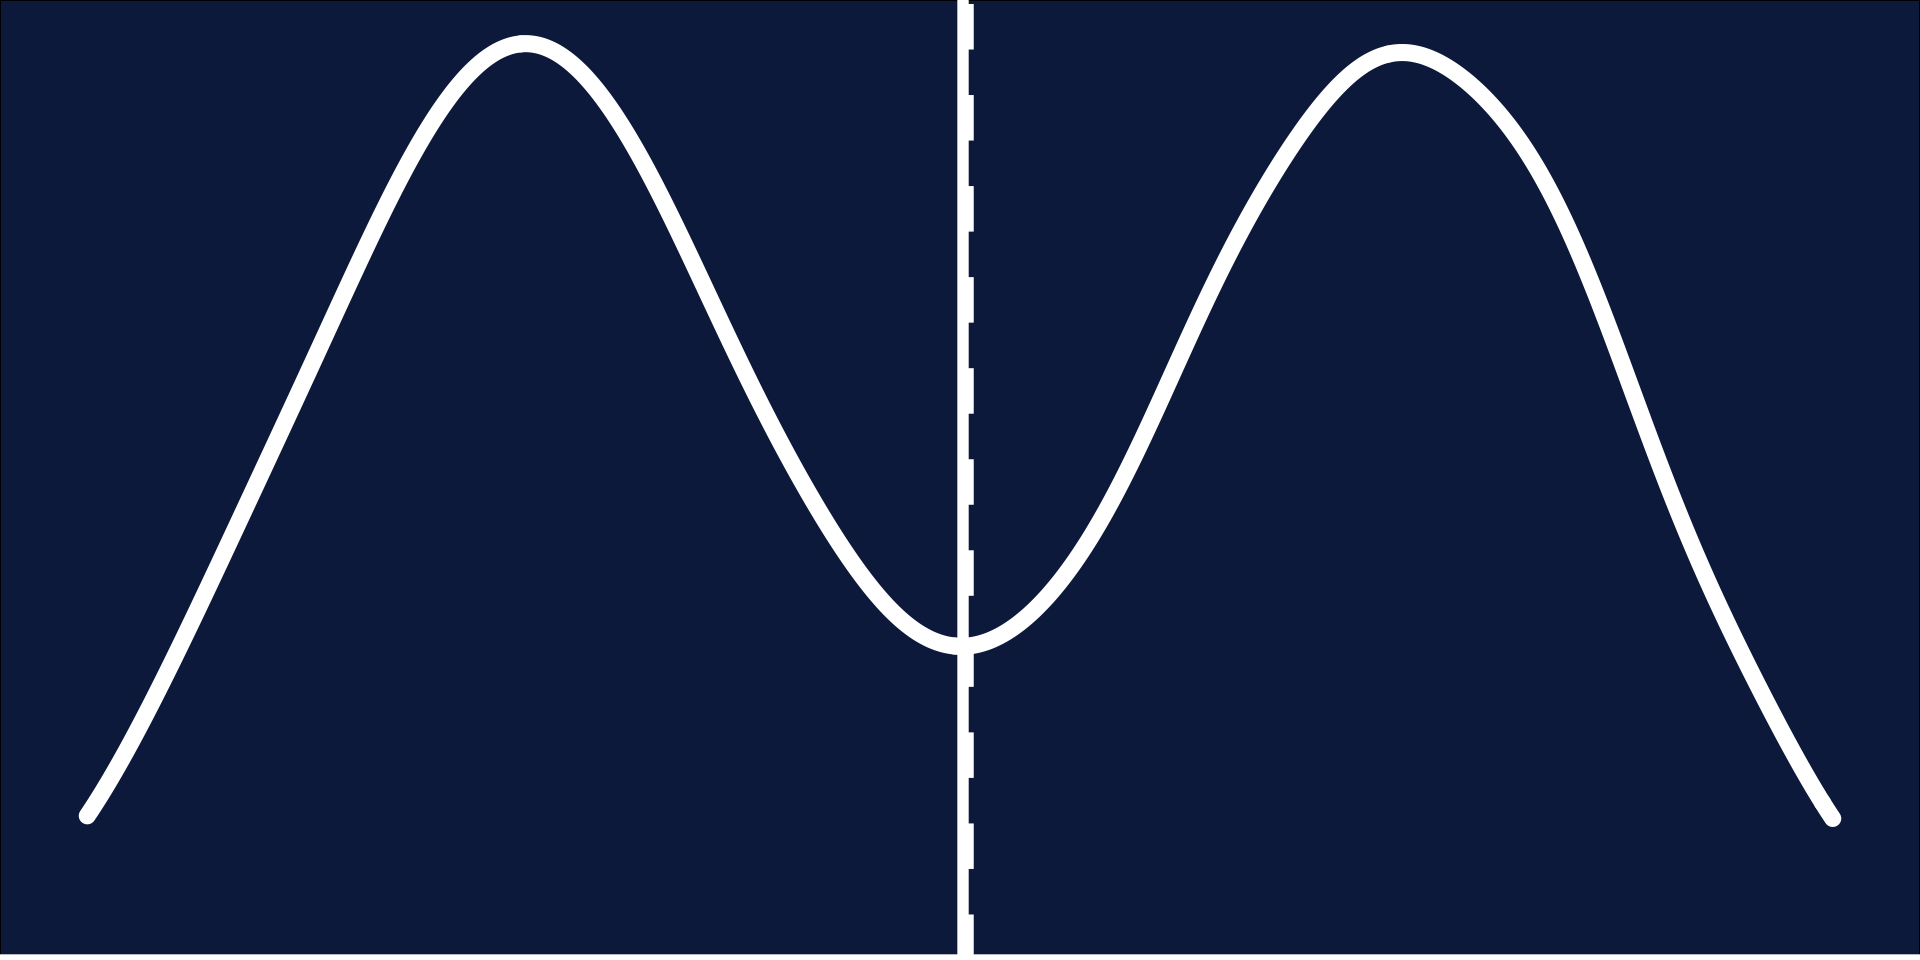
- Symmetrical*
- Mean = Median*
- Break up the data
Distributions: Bimodal
- Symmetrical*
- Mean = Median*
- Break up the data
Road Map
Data and Sampling
Distributions
Central Limit Theorem
Statistical Significance & Power
Hypothesis Testing
Central Limit Theorem: Uniform
- Uniform distribution is approximately normal with \(N > 10\)
- \(N > 30\) is sufficient for most distributions
Central Limit Theorem: Skewed
- Skewed distribution is approximately normal with \(N > 30\)
- Moderate to high skew may require \(N > 100\)…
- Transformations are more feasible than increasing your sample size
Normality: 68, 95, 99.7 rule
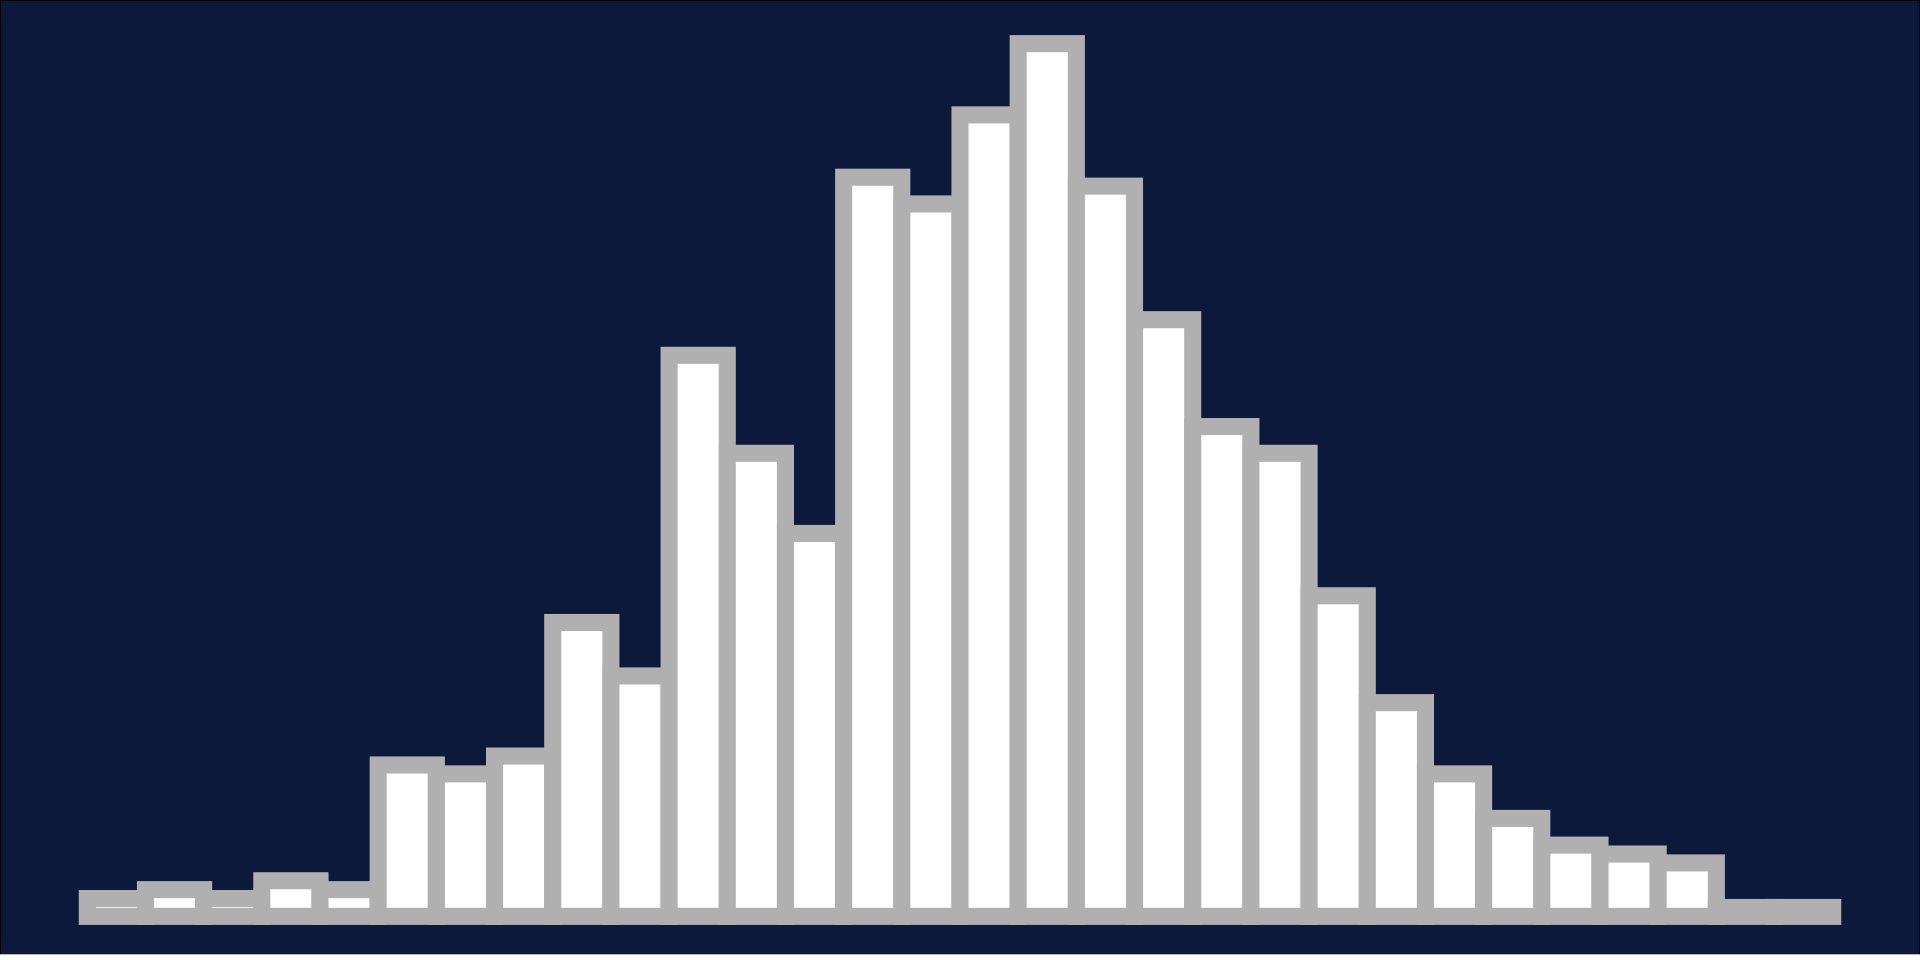
Normality: 68, 95, 99.7 rule
- 1 Standard deviation = 68%
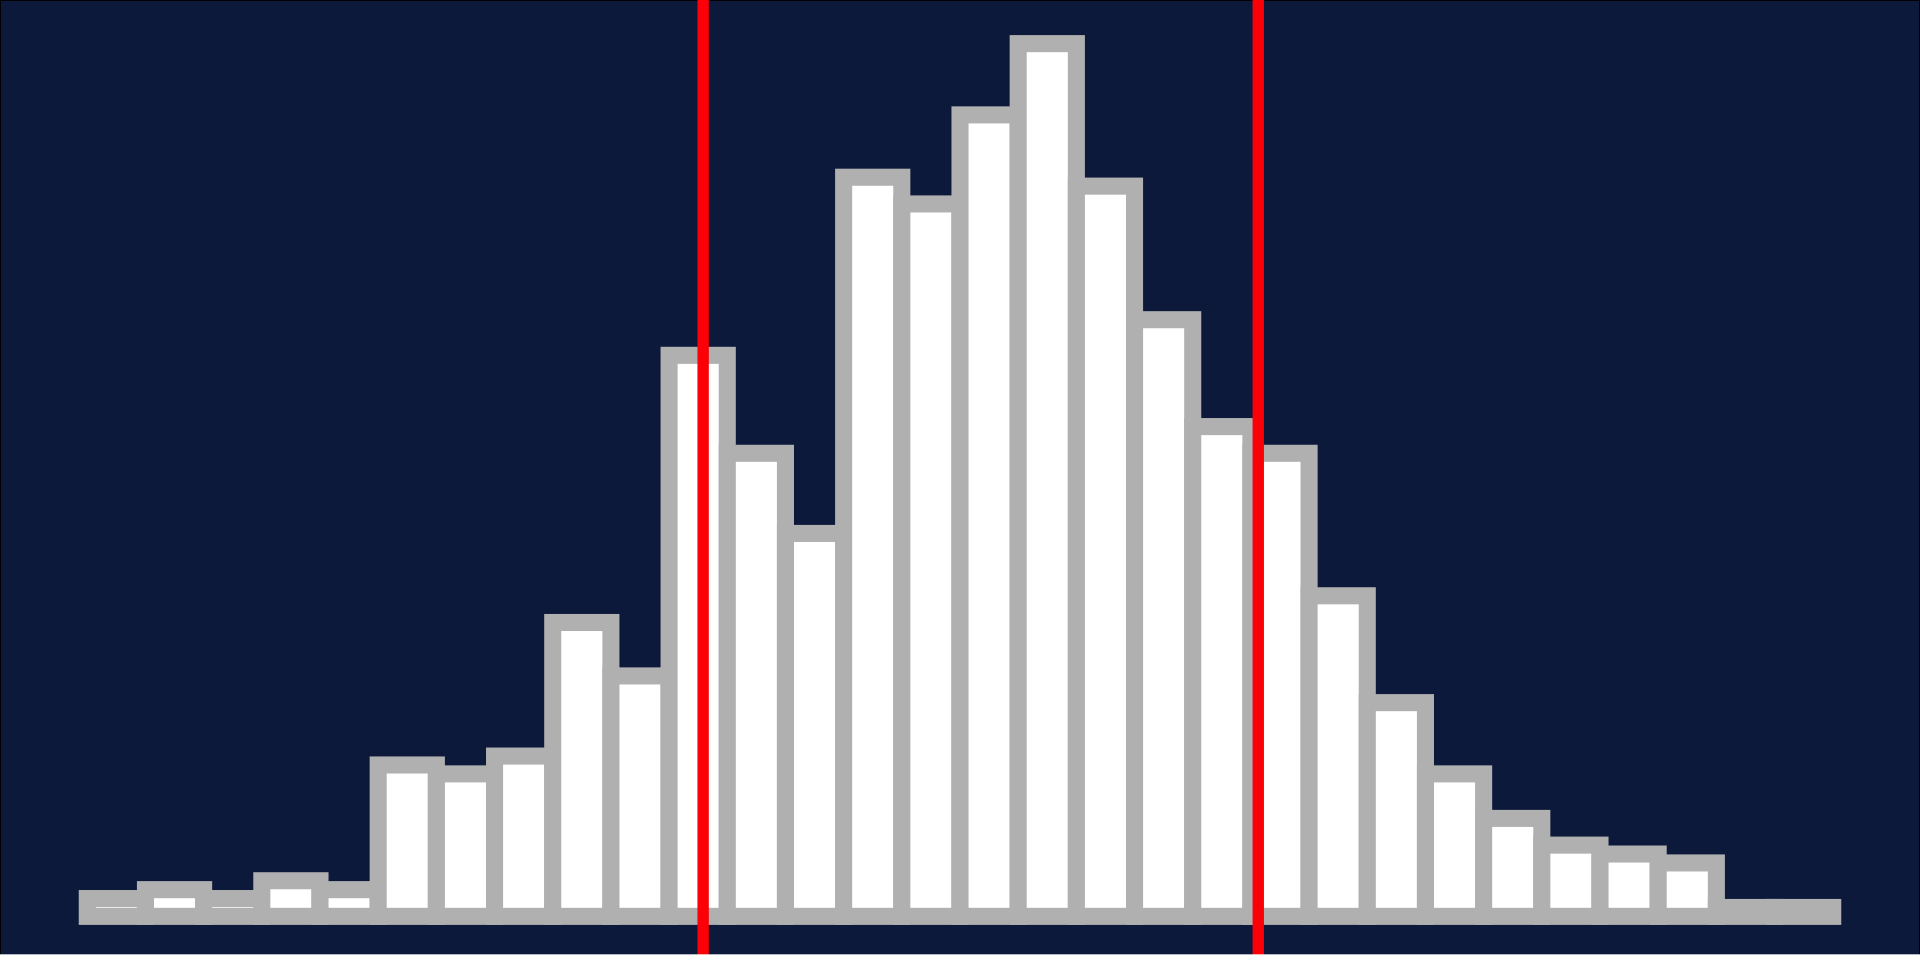
Normality: 68, 95, 99.7 rule
- 1 Standard deviation = 68%
- 2 Standard deviations = 95%
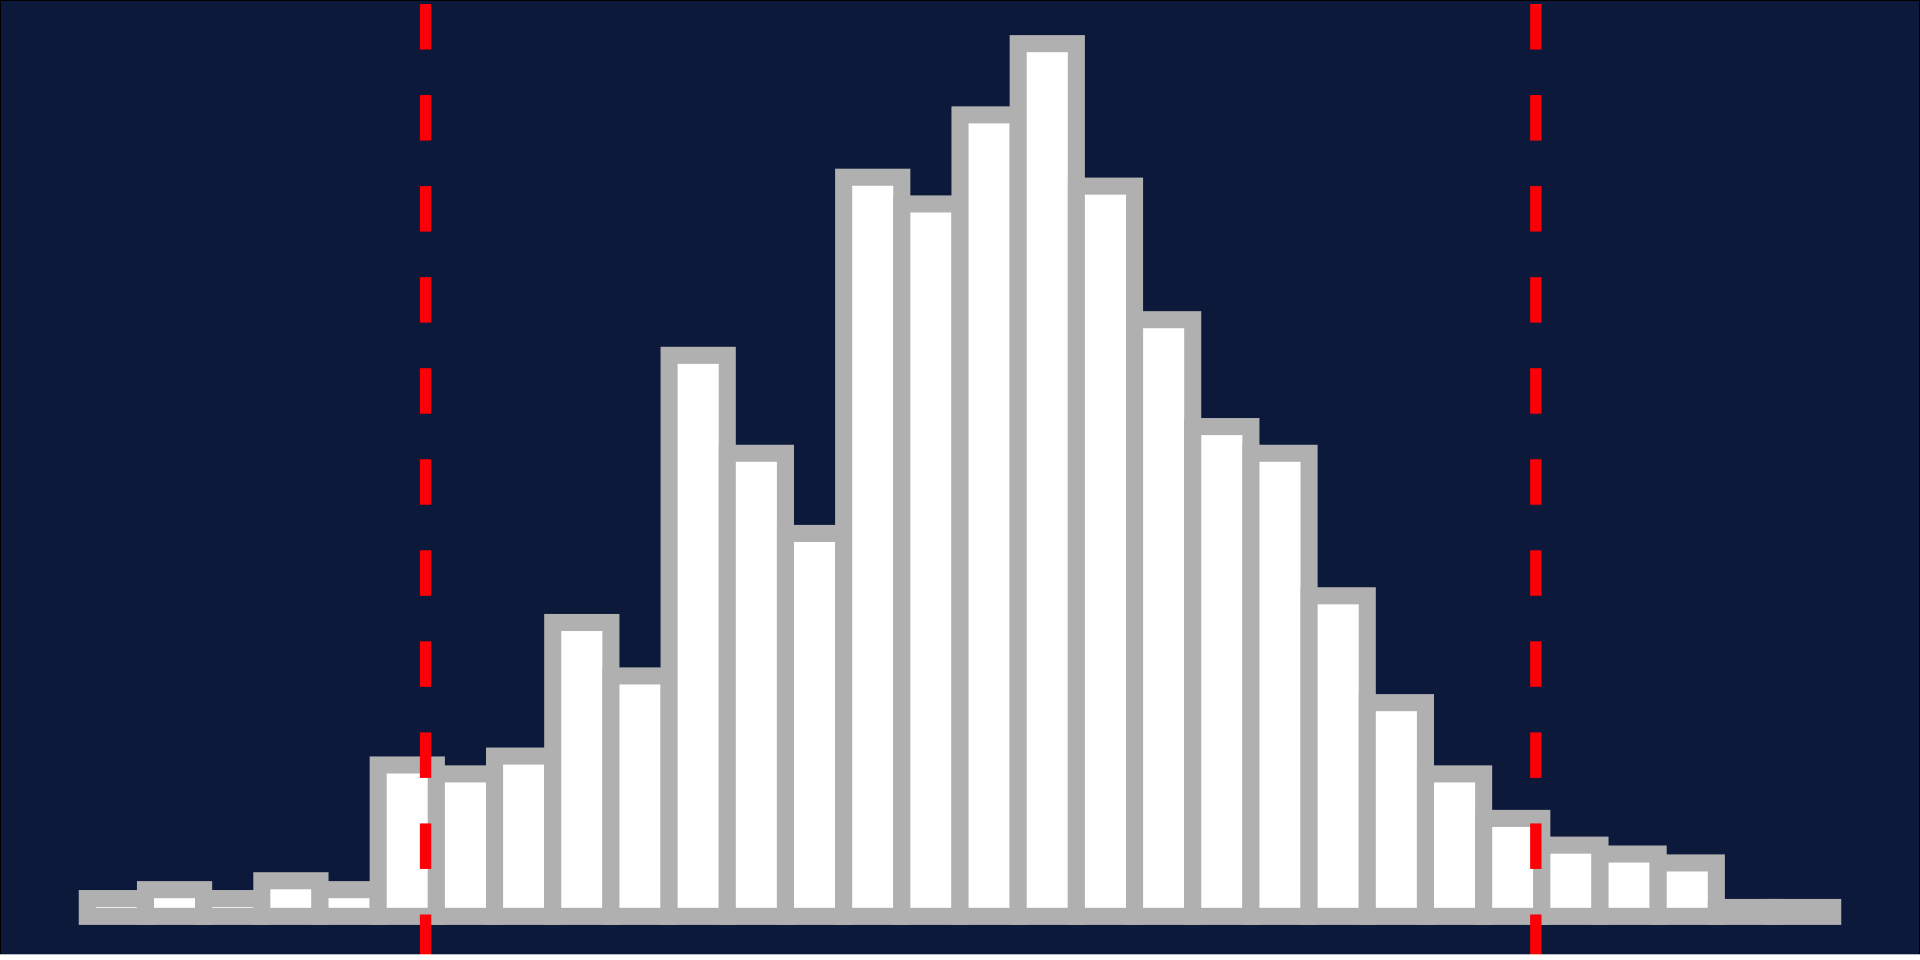
Normality: 68, 95, 99.7 rule
- 1 Standard deviation = 68%
- 2 Standard deviations = 95%
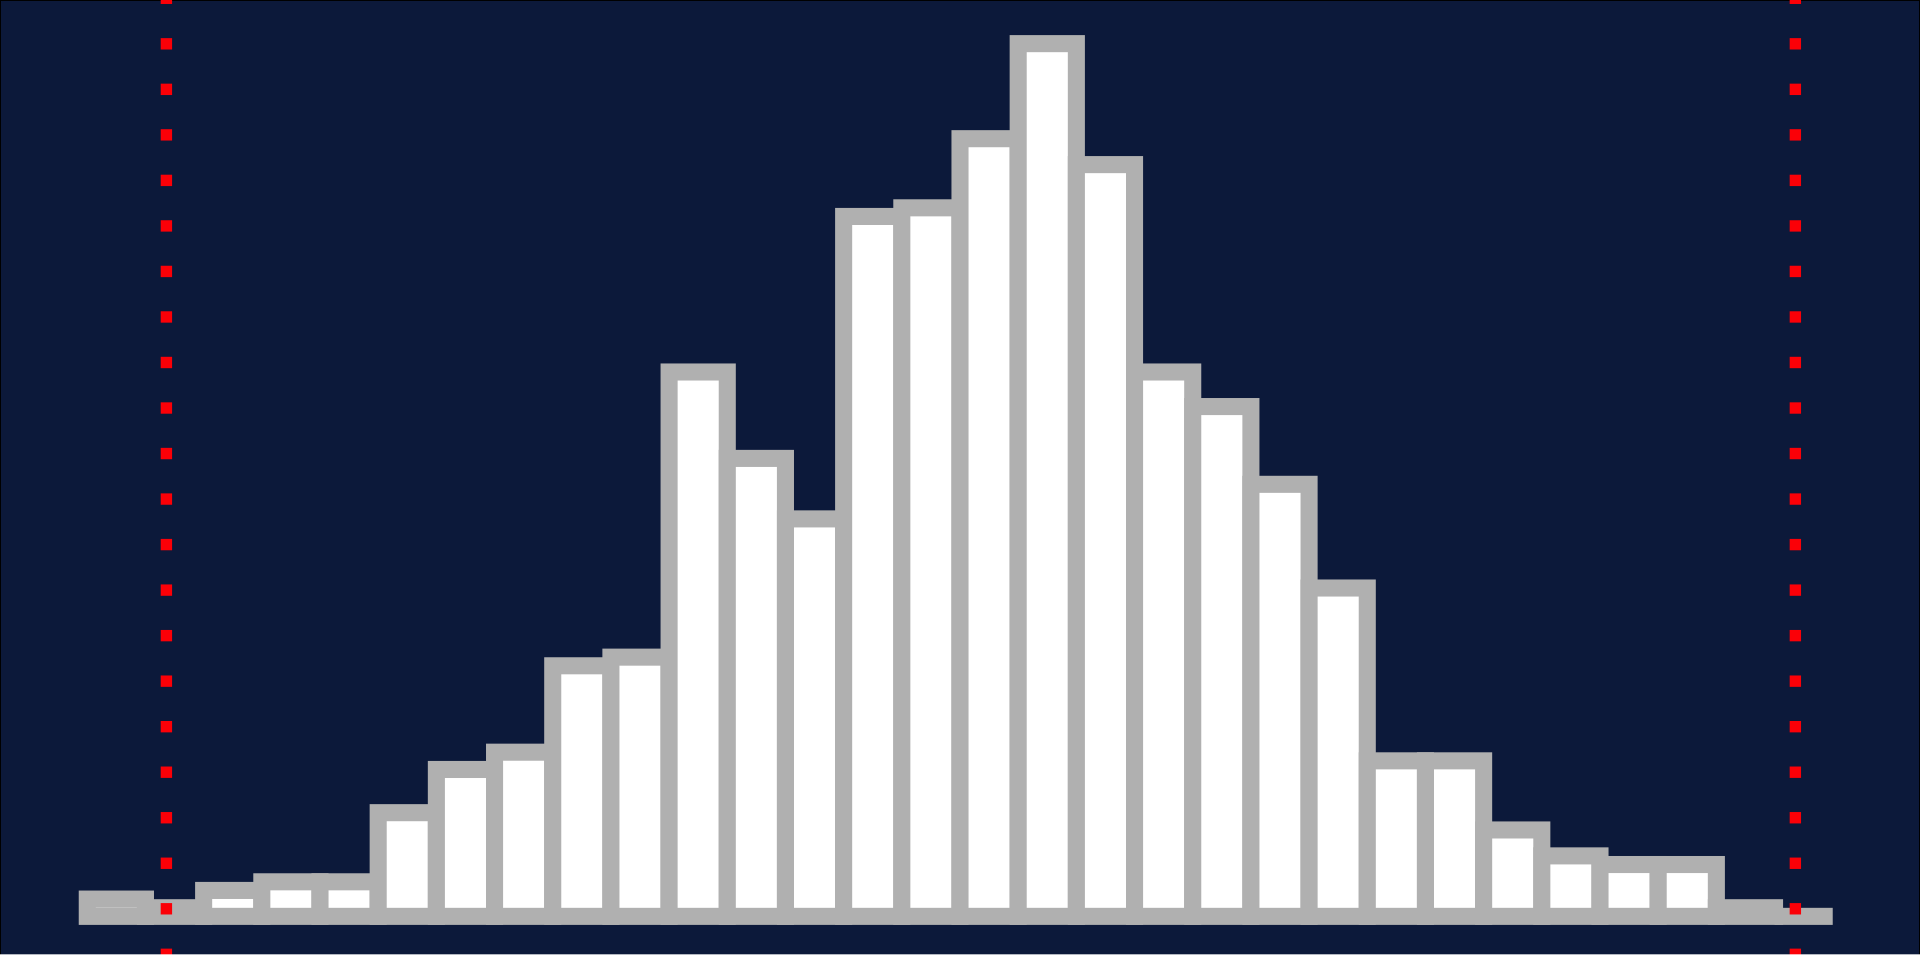
- 3 Standard deviations = 99.7%
Normality: 68, 95, 99.7 rule
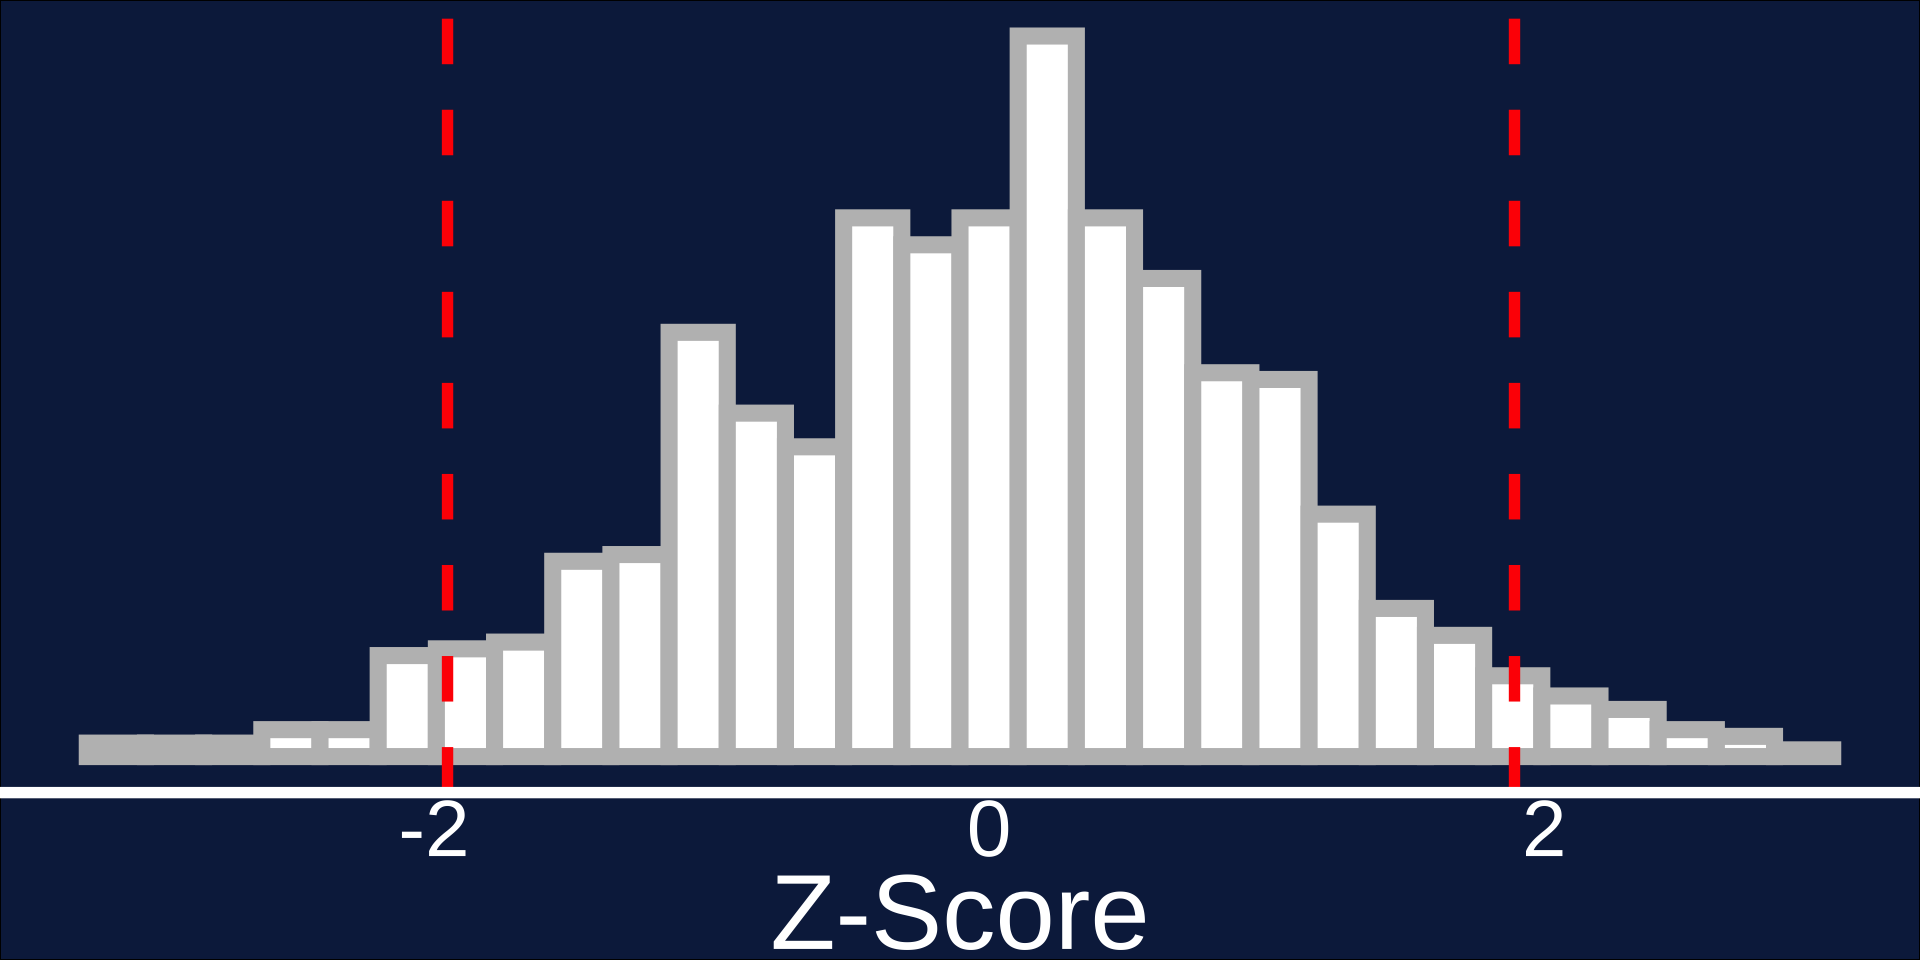
Z-Score
The number of standard deviations a value falls above or below the mean - e.g., 2 standard deviations: \(Z = 2\)
Road Map
Data and Sampling
Distributions
Central Limit Theorem
Statistical Significance & Power
Hypothesis Testing

P-Values
What is the likelihood that your data is different that expected from random variation?
P-Values
What is the likelihood that your data is different that expected from random variation?
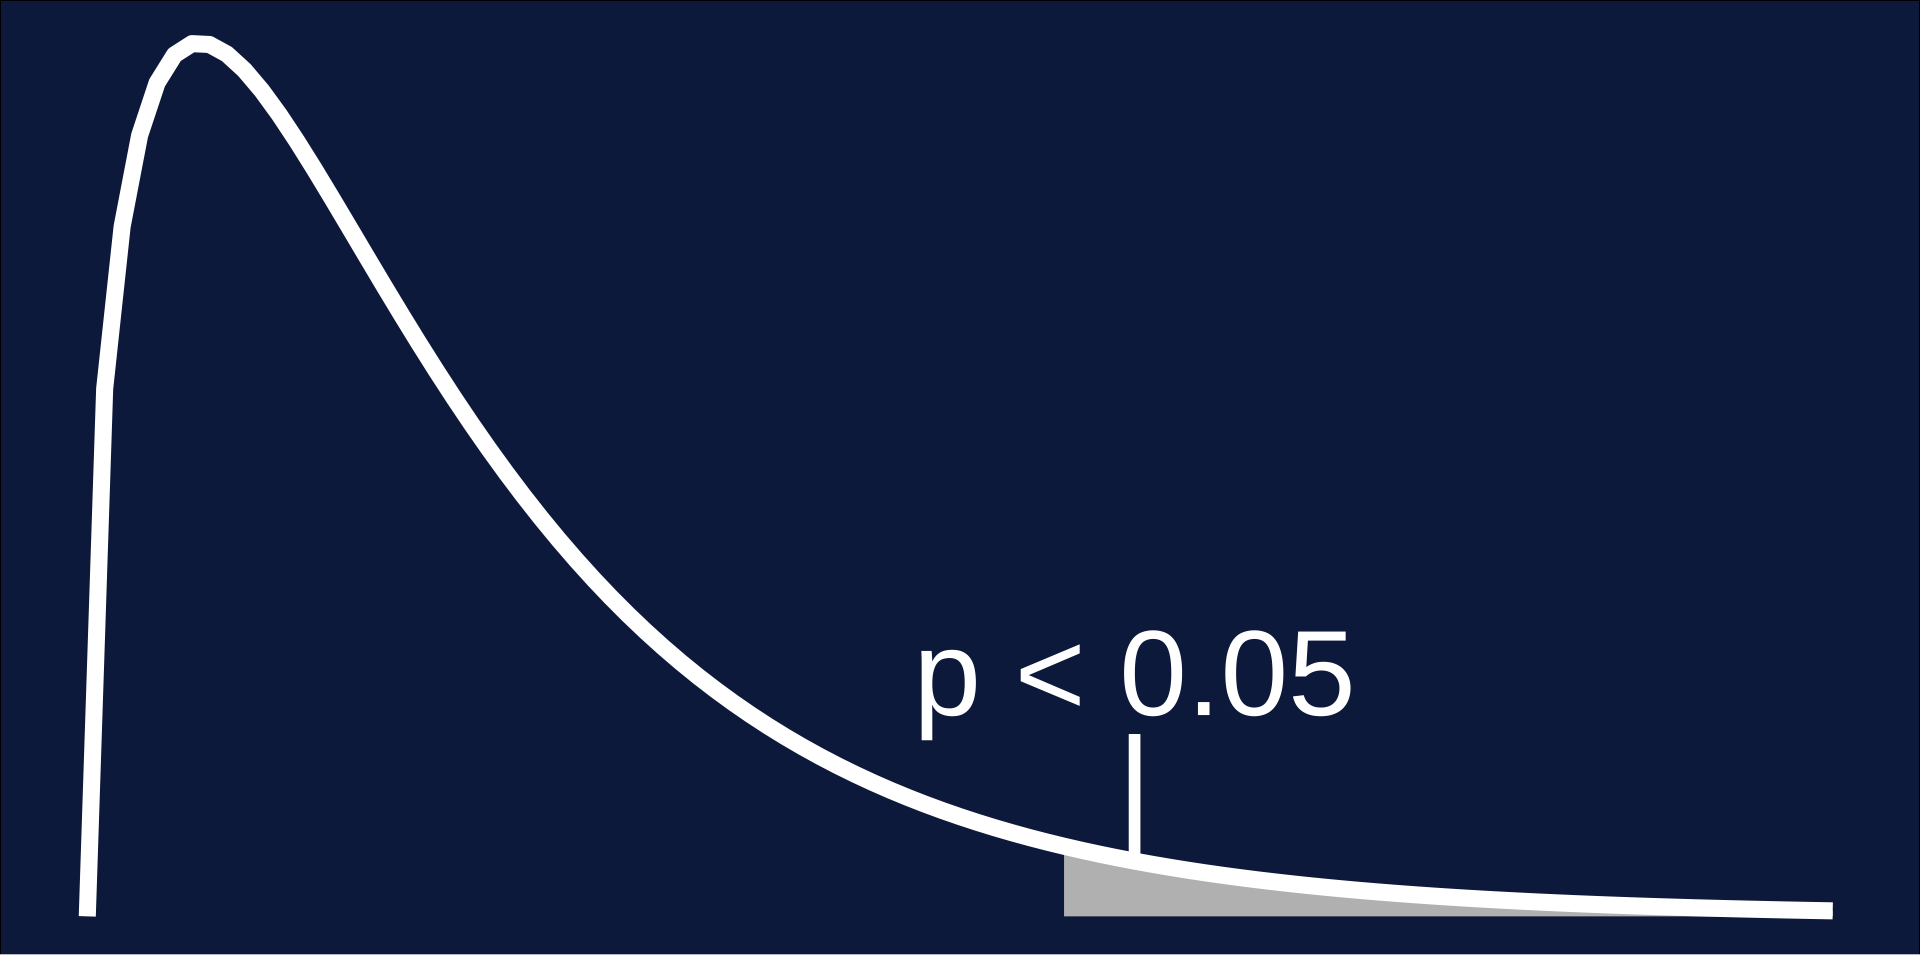
F-Distribution
Probability of observing data at least as favorable to the alternative hypothesis, if the null hypothesis is not true.
Translation: The relationship that we find is not from random chance.
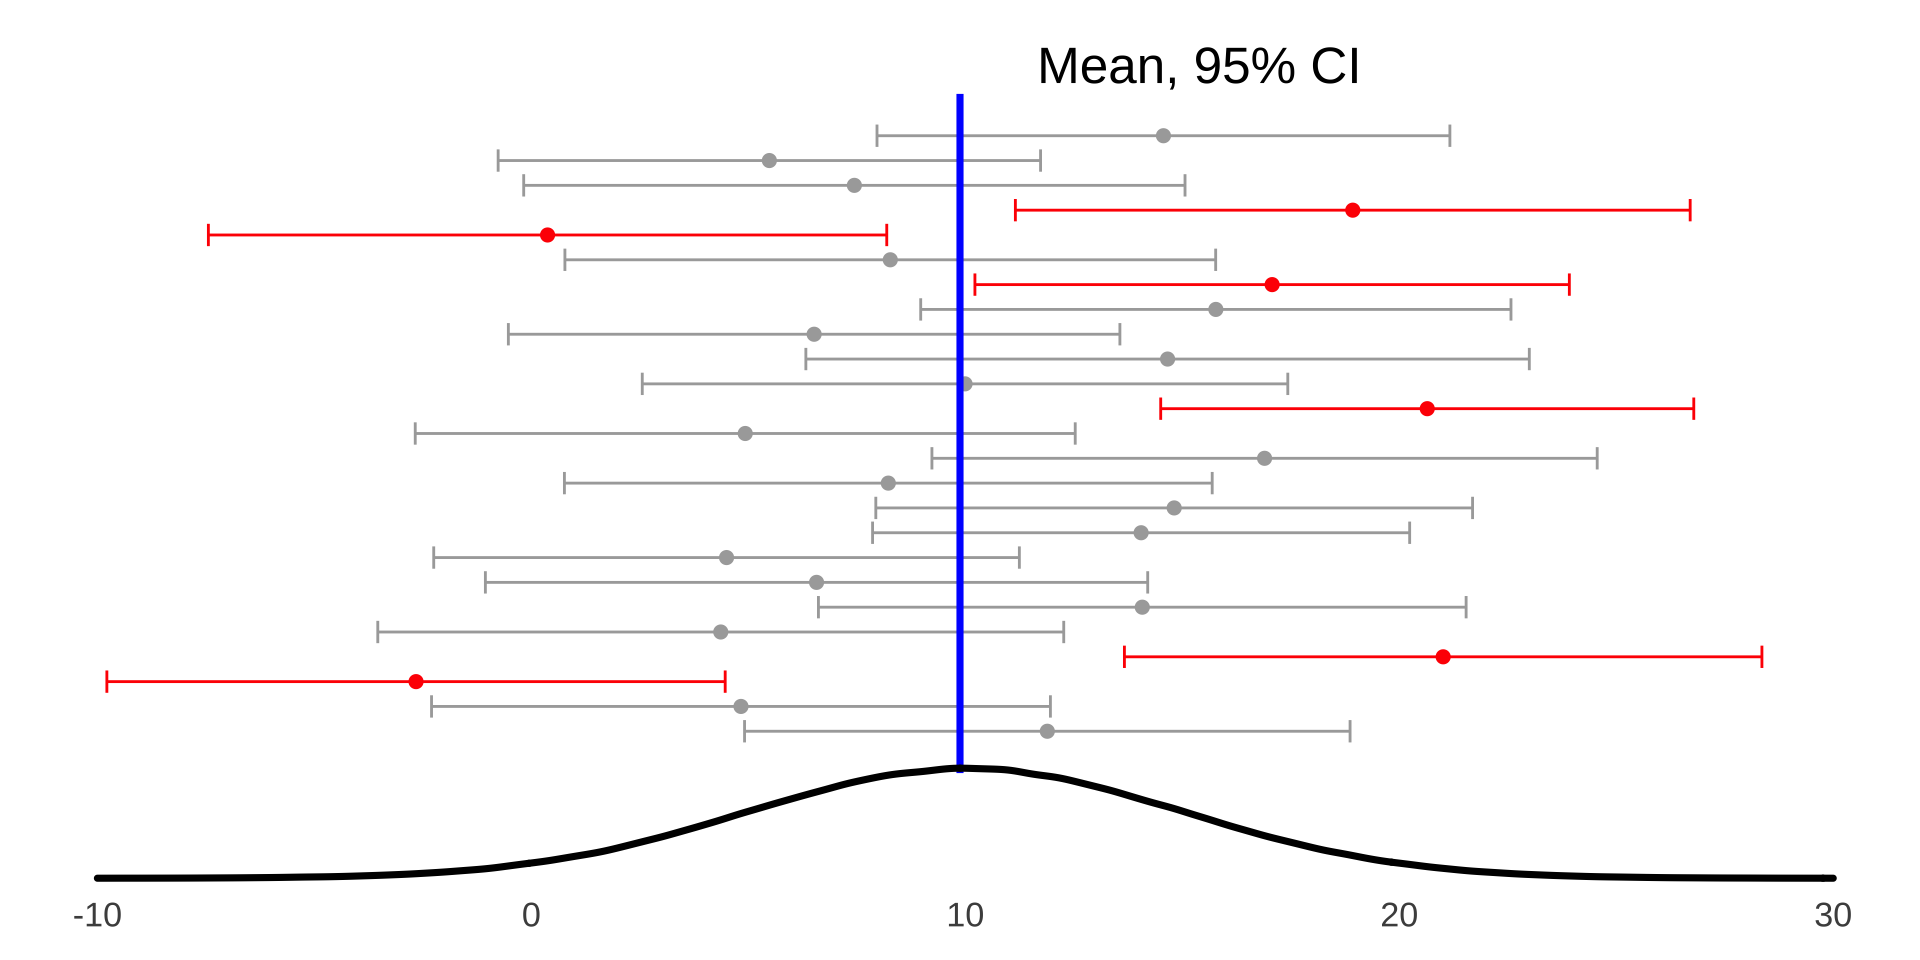
Confidence Intervals
- Significance as \(< 0.05\) we are saying that 5% of our conclusions will be incorrect.
- This means that we can have 95% Confidence that our samples will contain the true value of a statistic from the population.
- Example: we collect 30 samples and measure the mean \(\bar{X}\), so 27.5 of those samples will contain the population mean \(\mu\)
Confidence Intervals
Statistical Error
Statistical Error
Statistical Error
Statistical Error
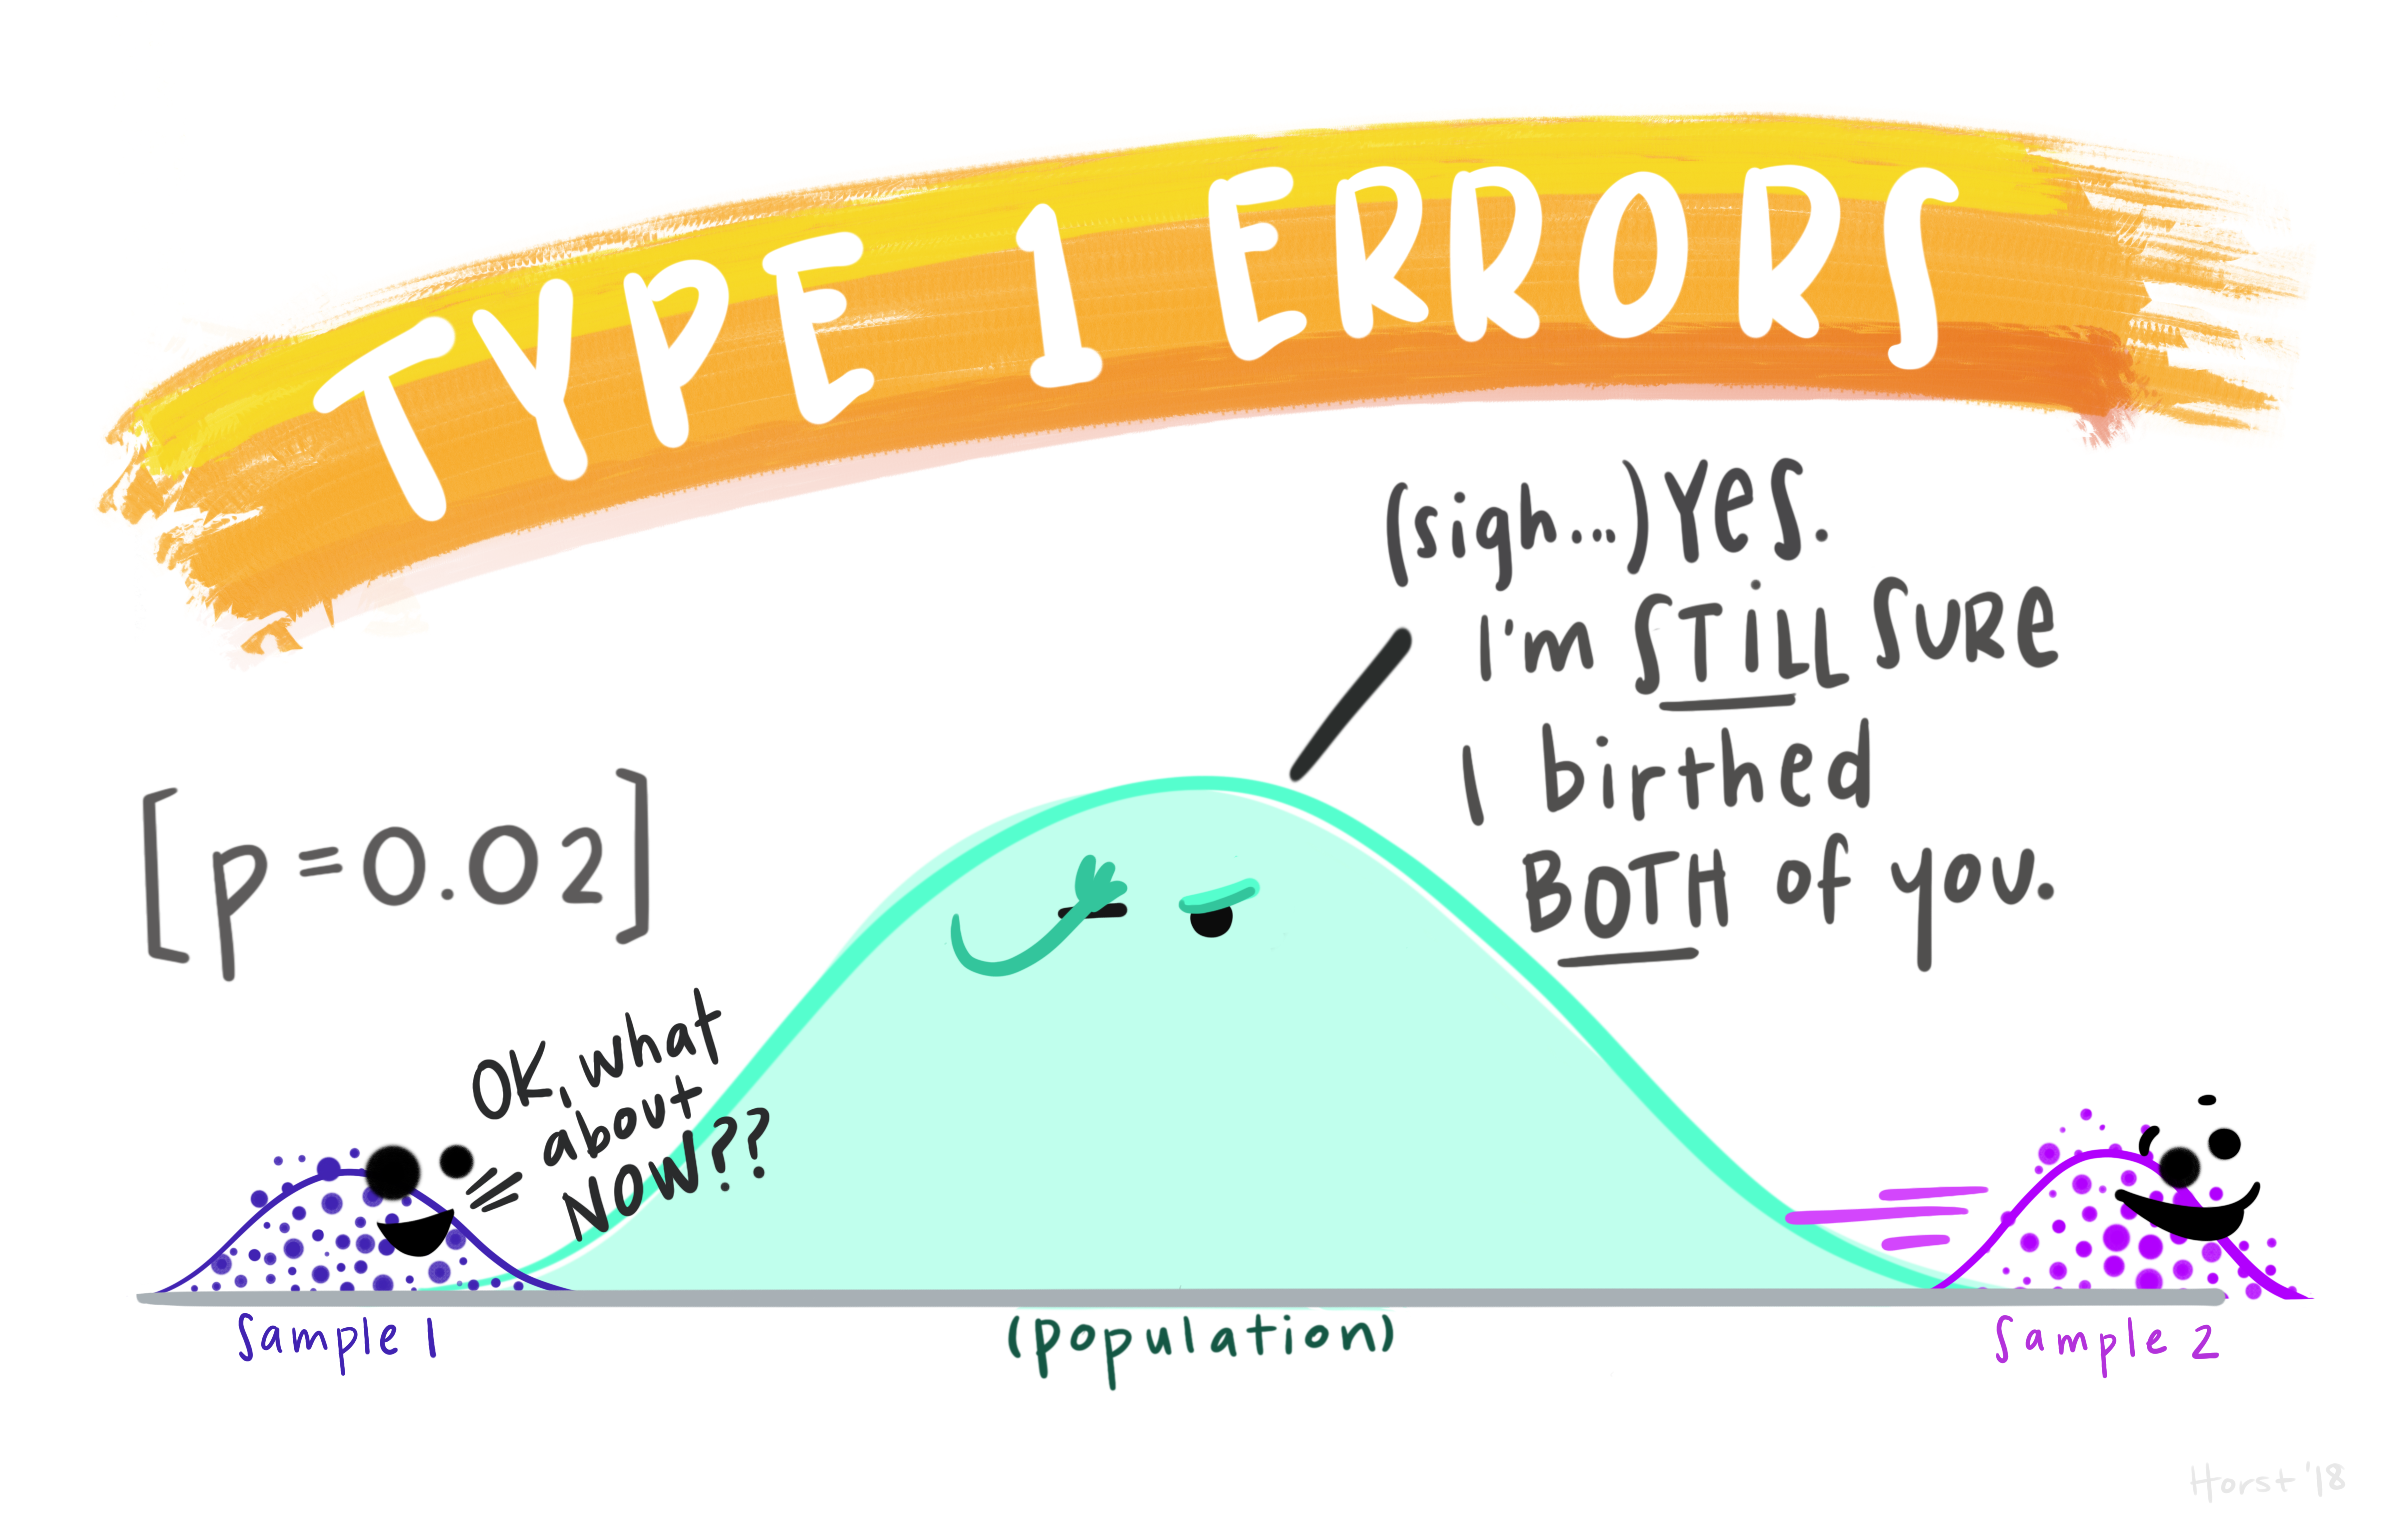
- A Type I Error is rejecting the null hypothesis when \(H_0\) is true.
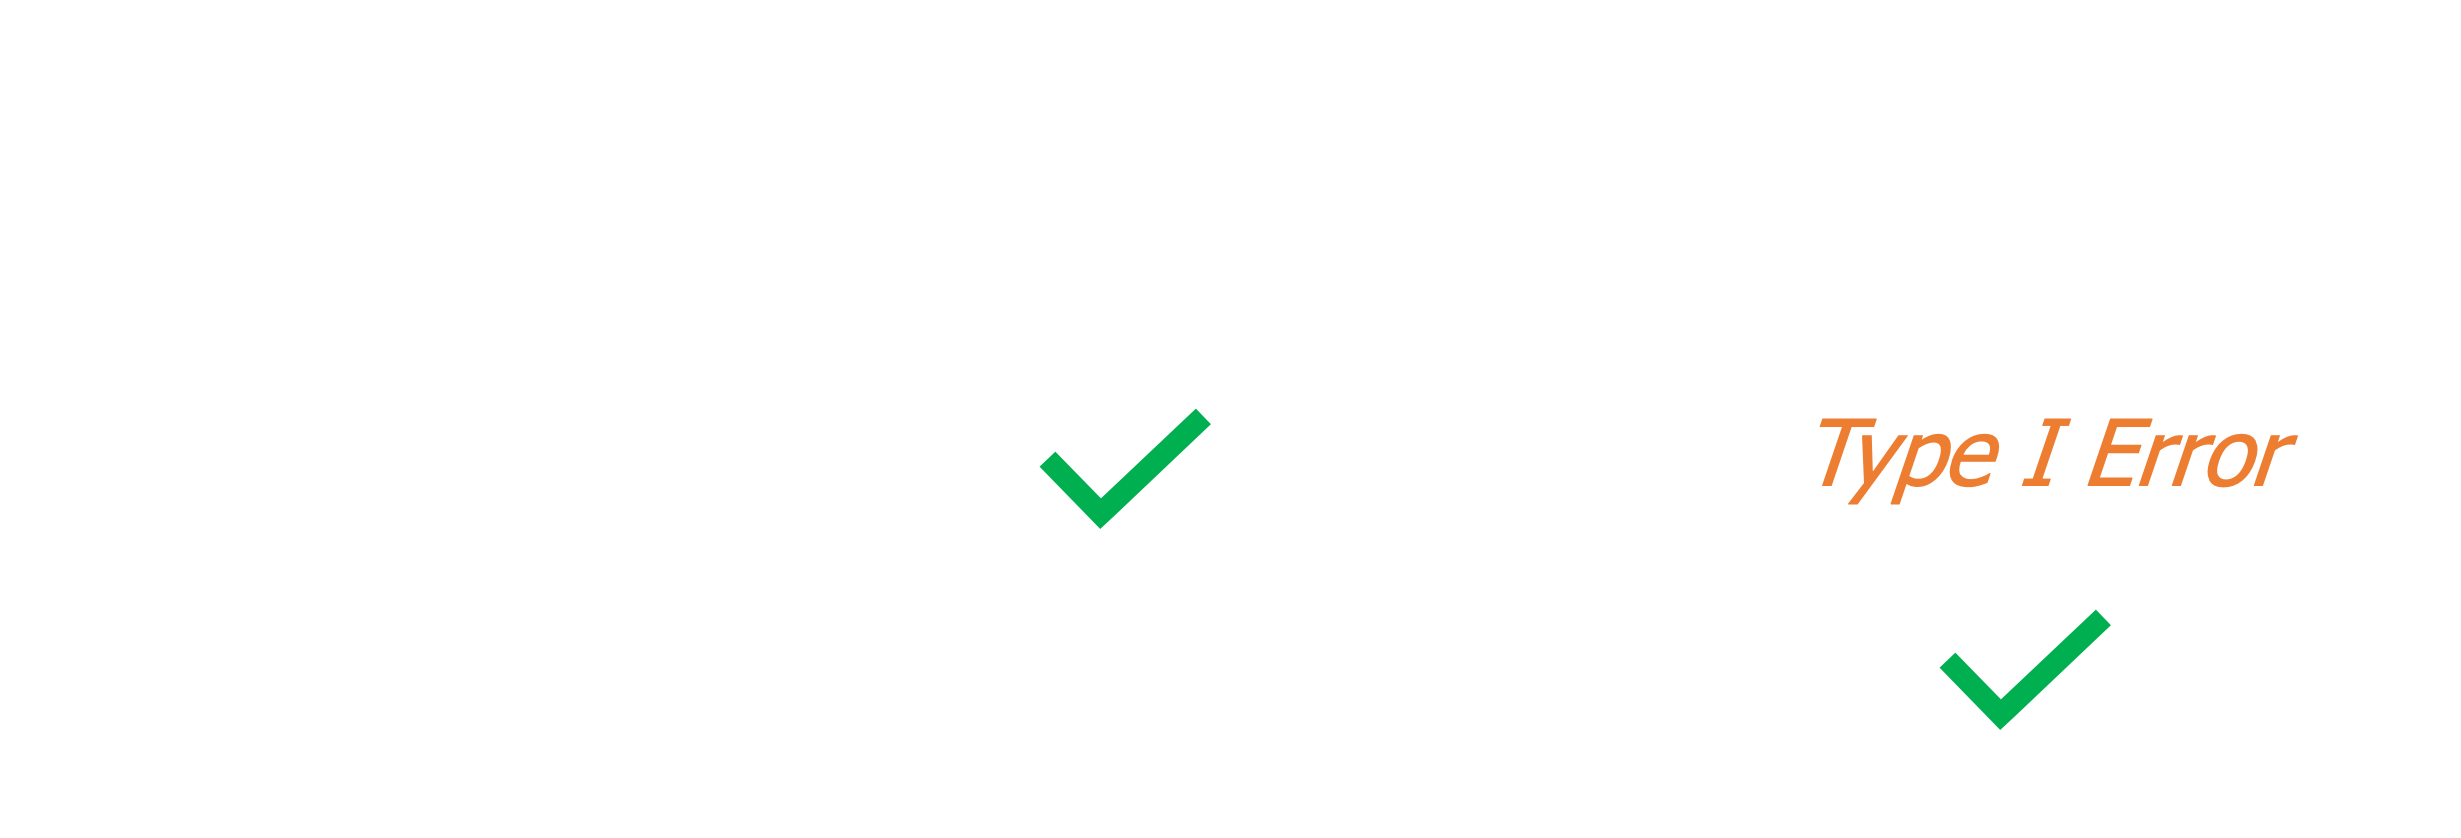
Statistical Error
A Type I Error is rejecting the null hypothesis when \(H_0\) is true
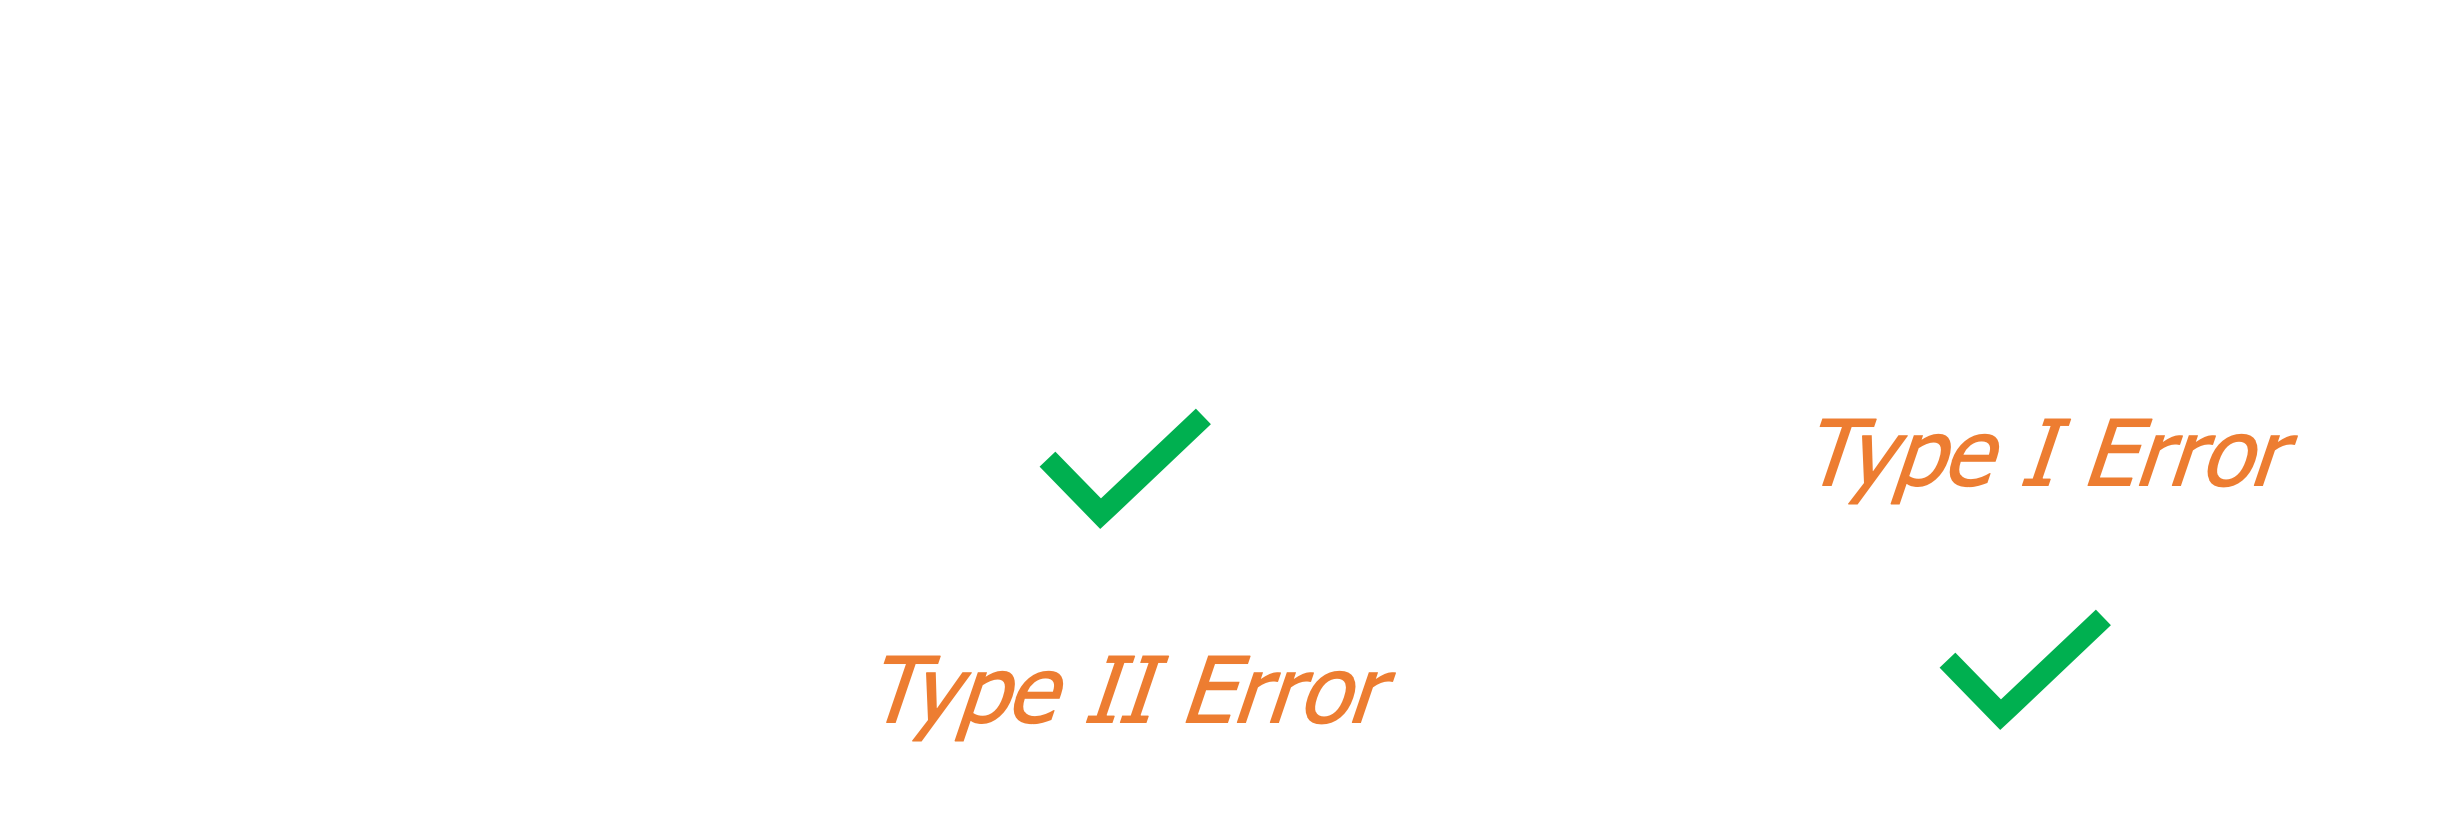
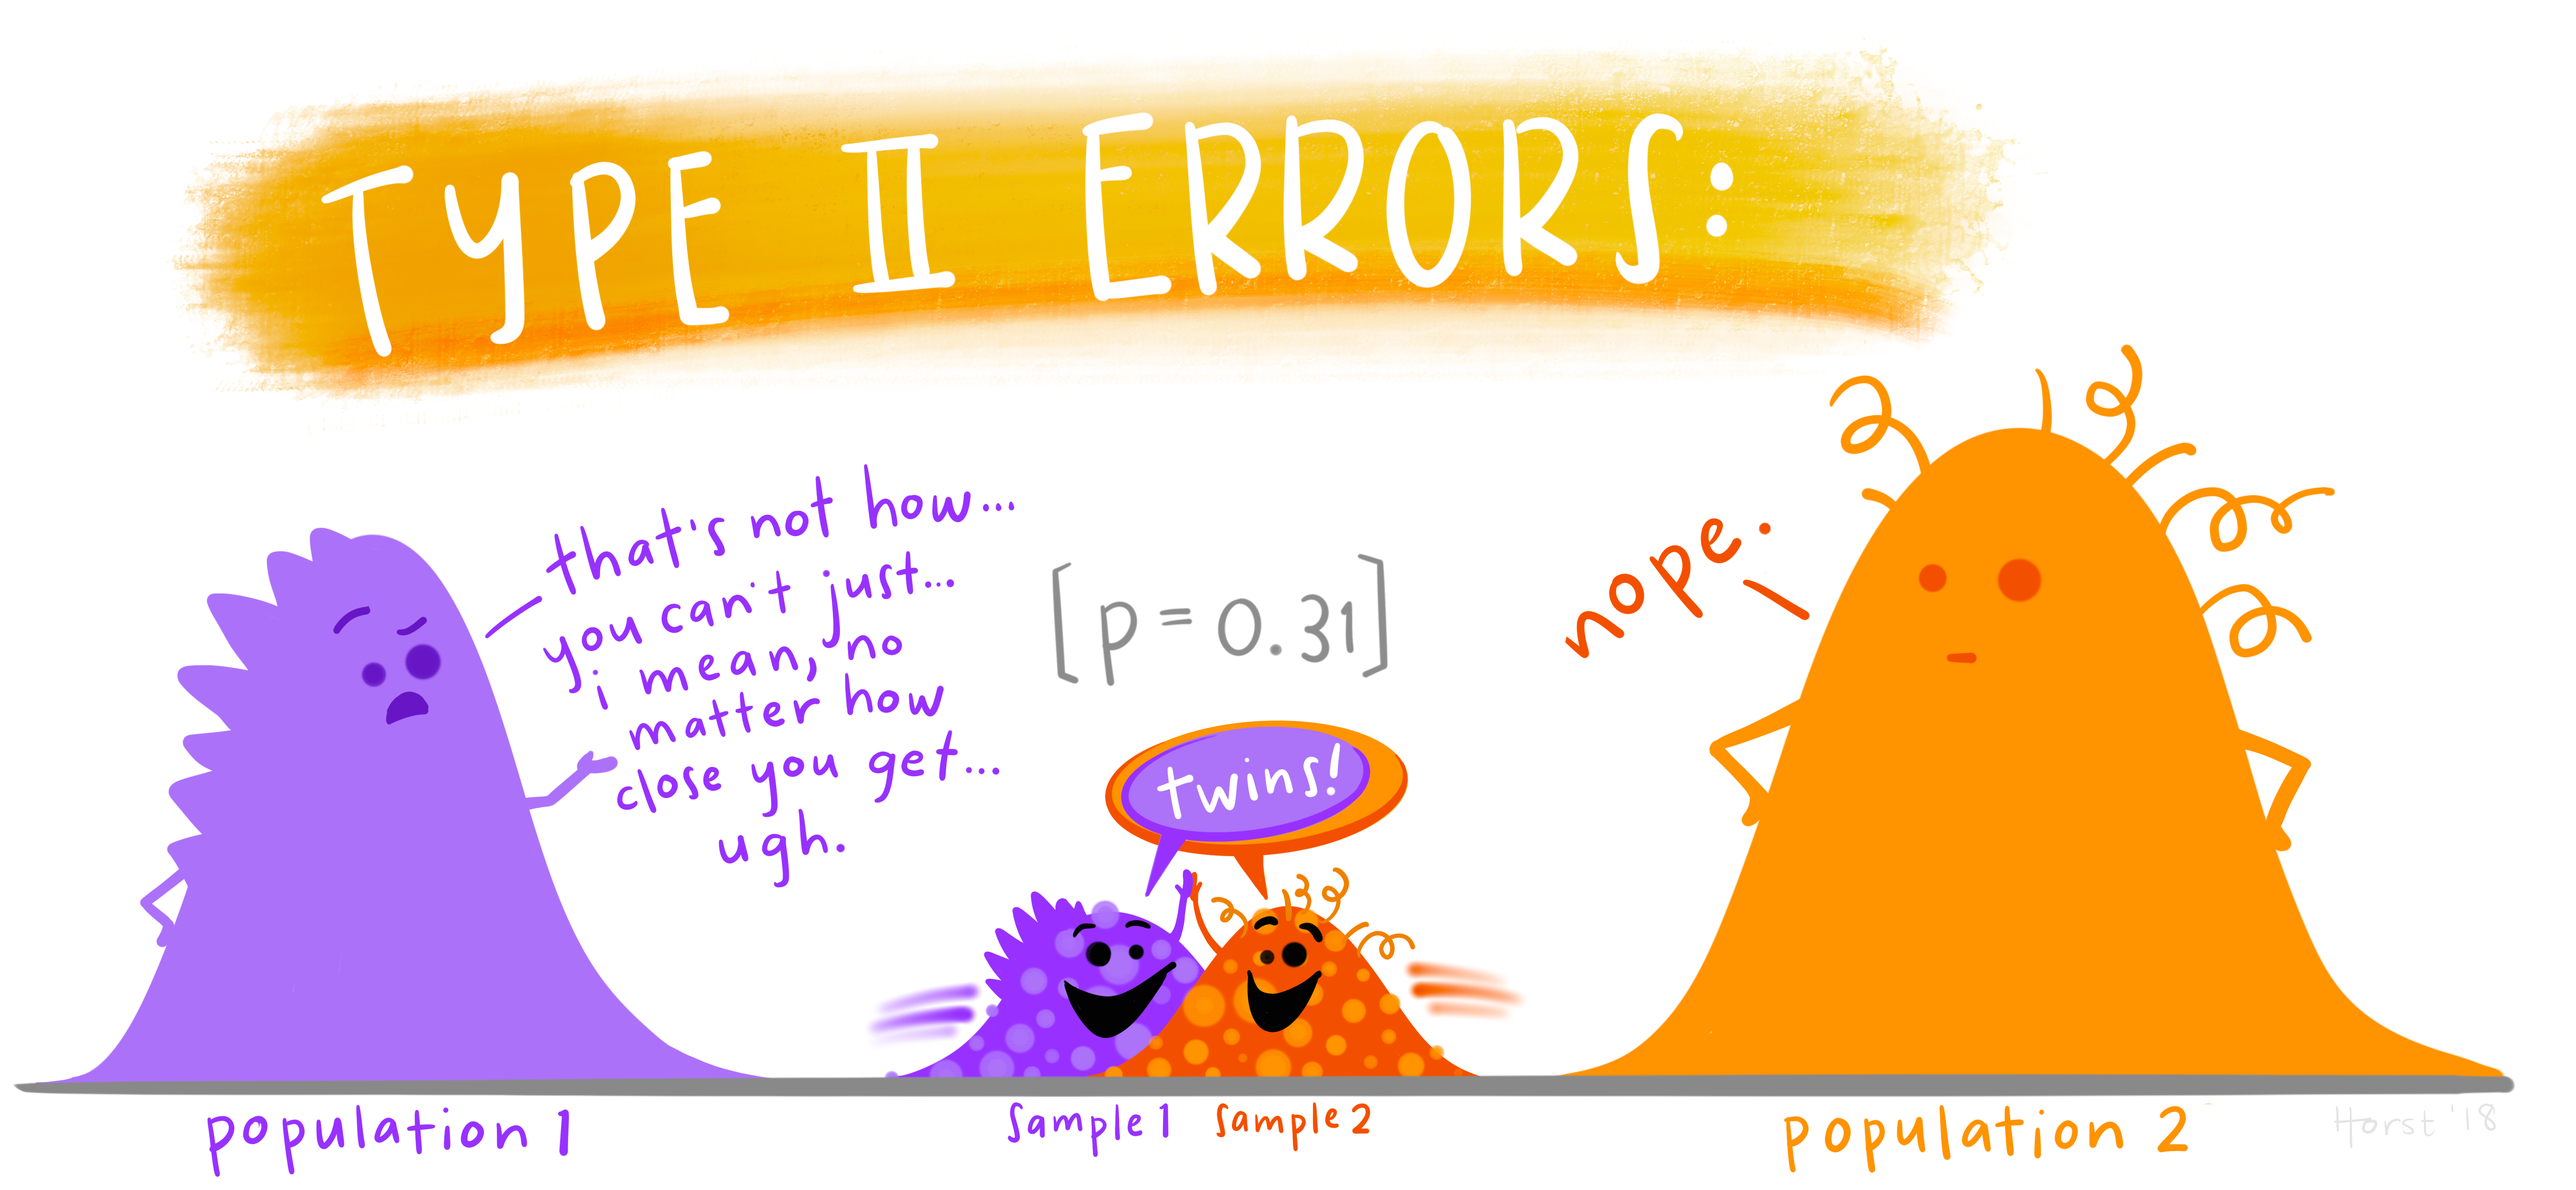
A Type II Error is rejecting the null hypothesis when \(H_A\) is true
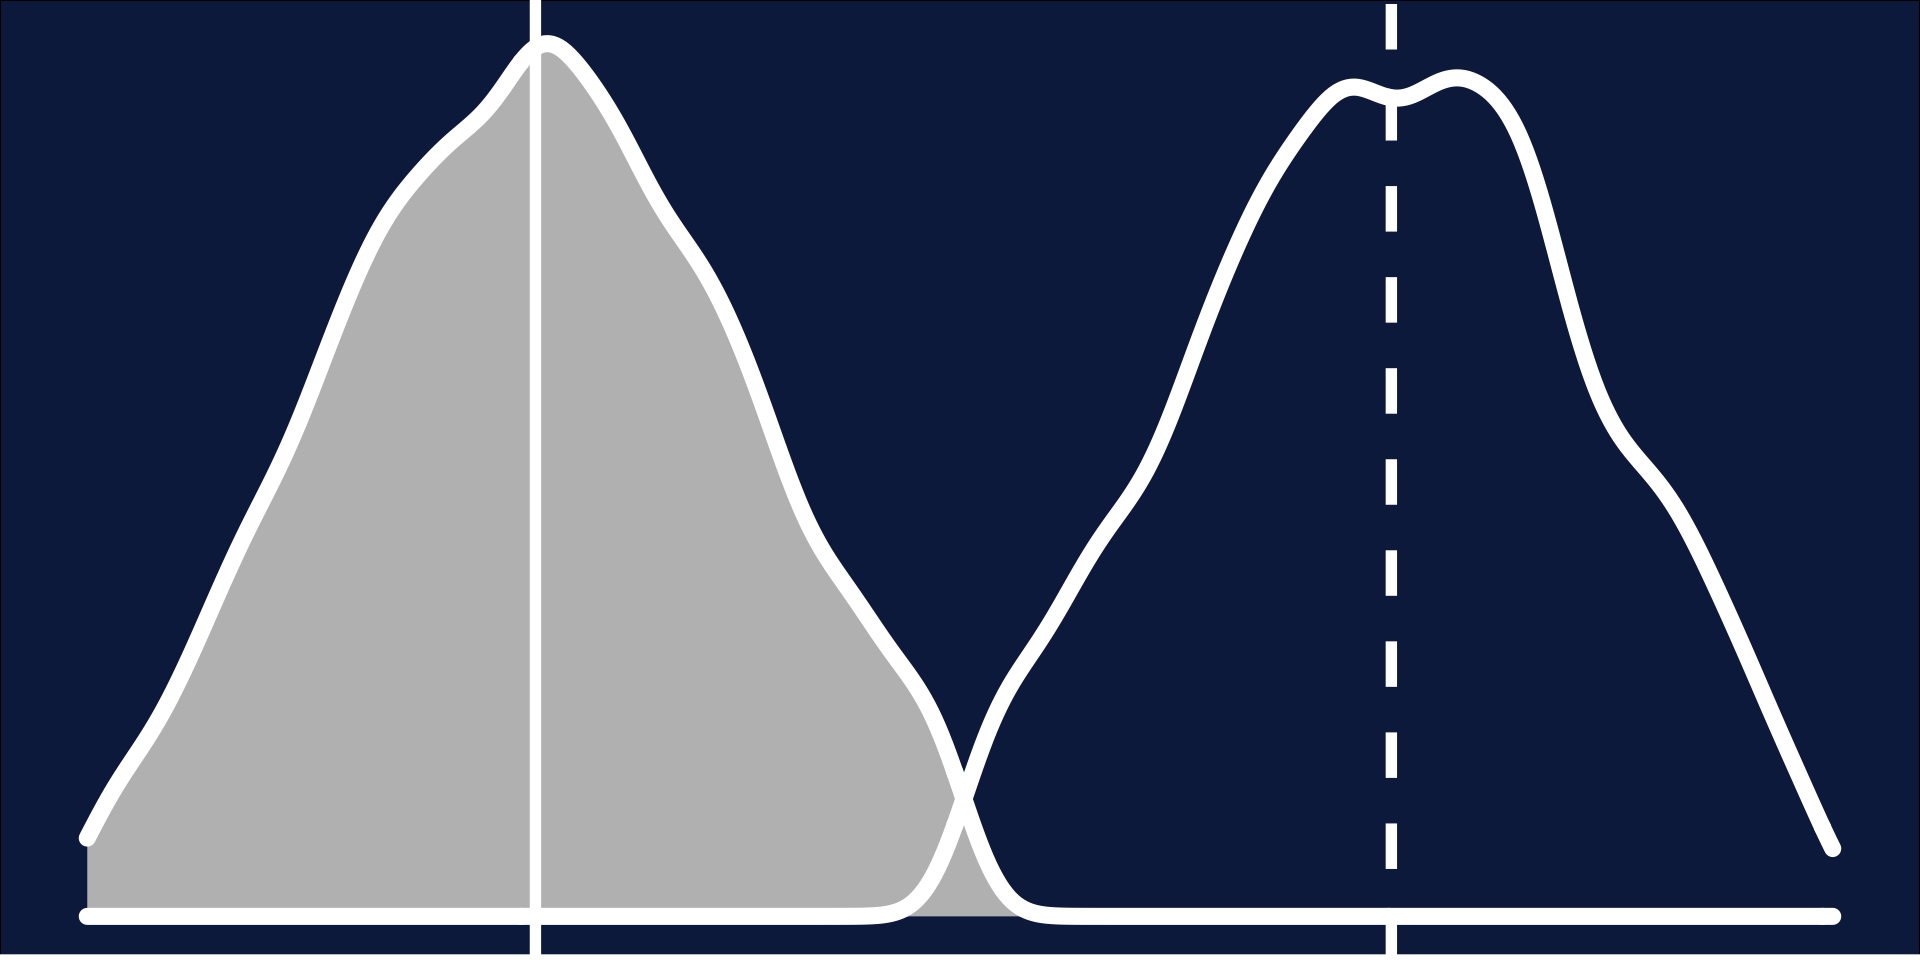
Statistical Error: Type I Error
Statistical Error: Type II Error
Statistical Power
Power = 1 - Type II Error
- Low Statistical Power: Large risk of committing Type II errors, e.g. a false negative.
- High Statistical Power: Small risk of committing Type II errors.
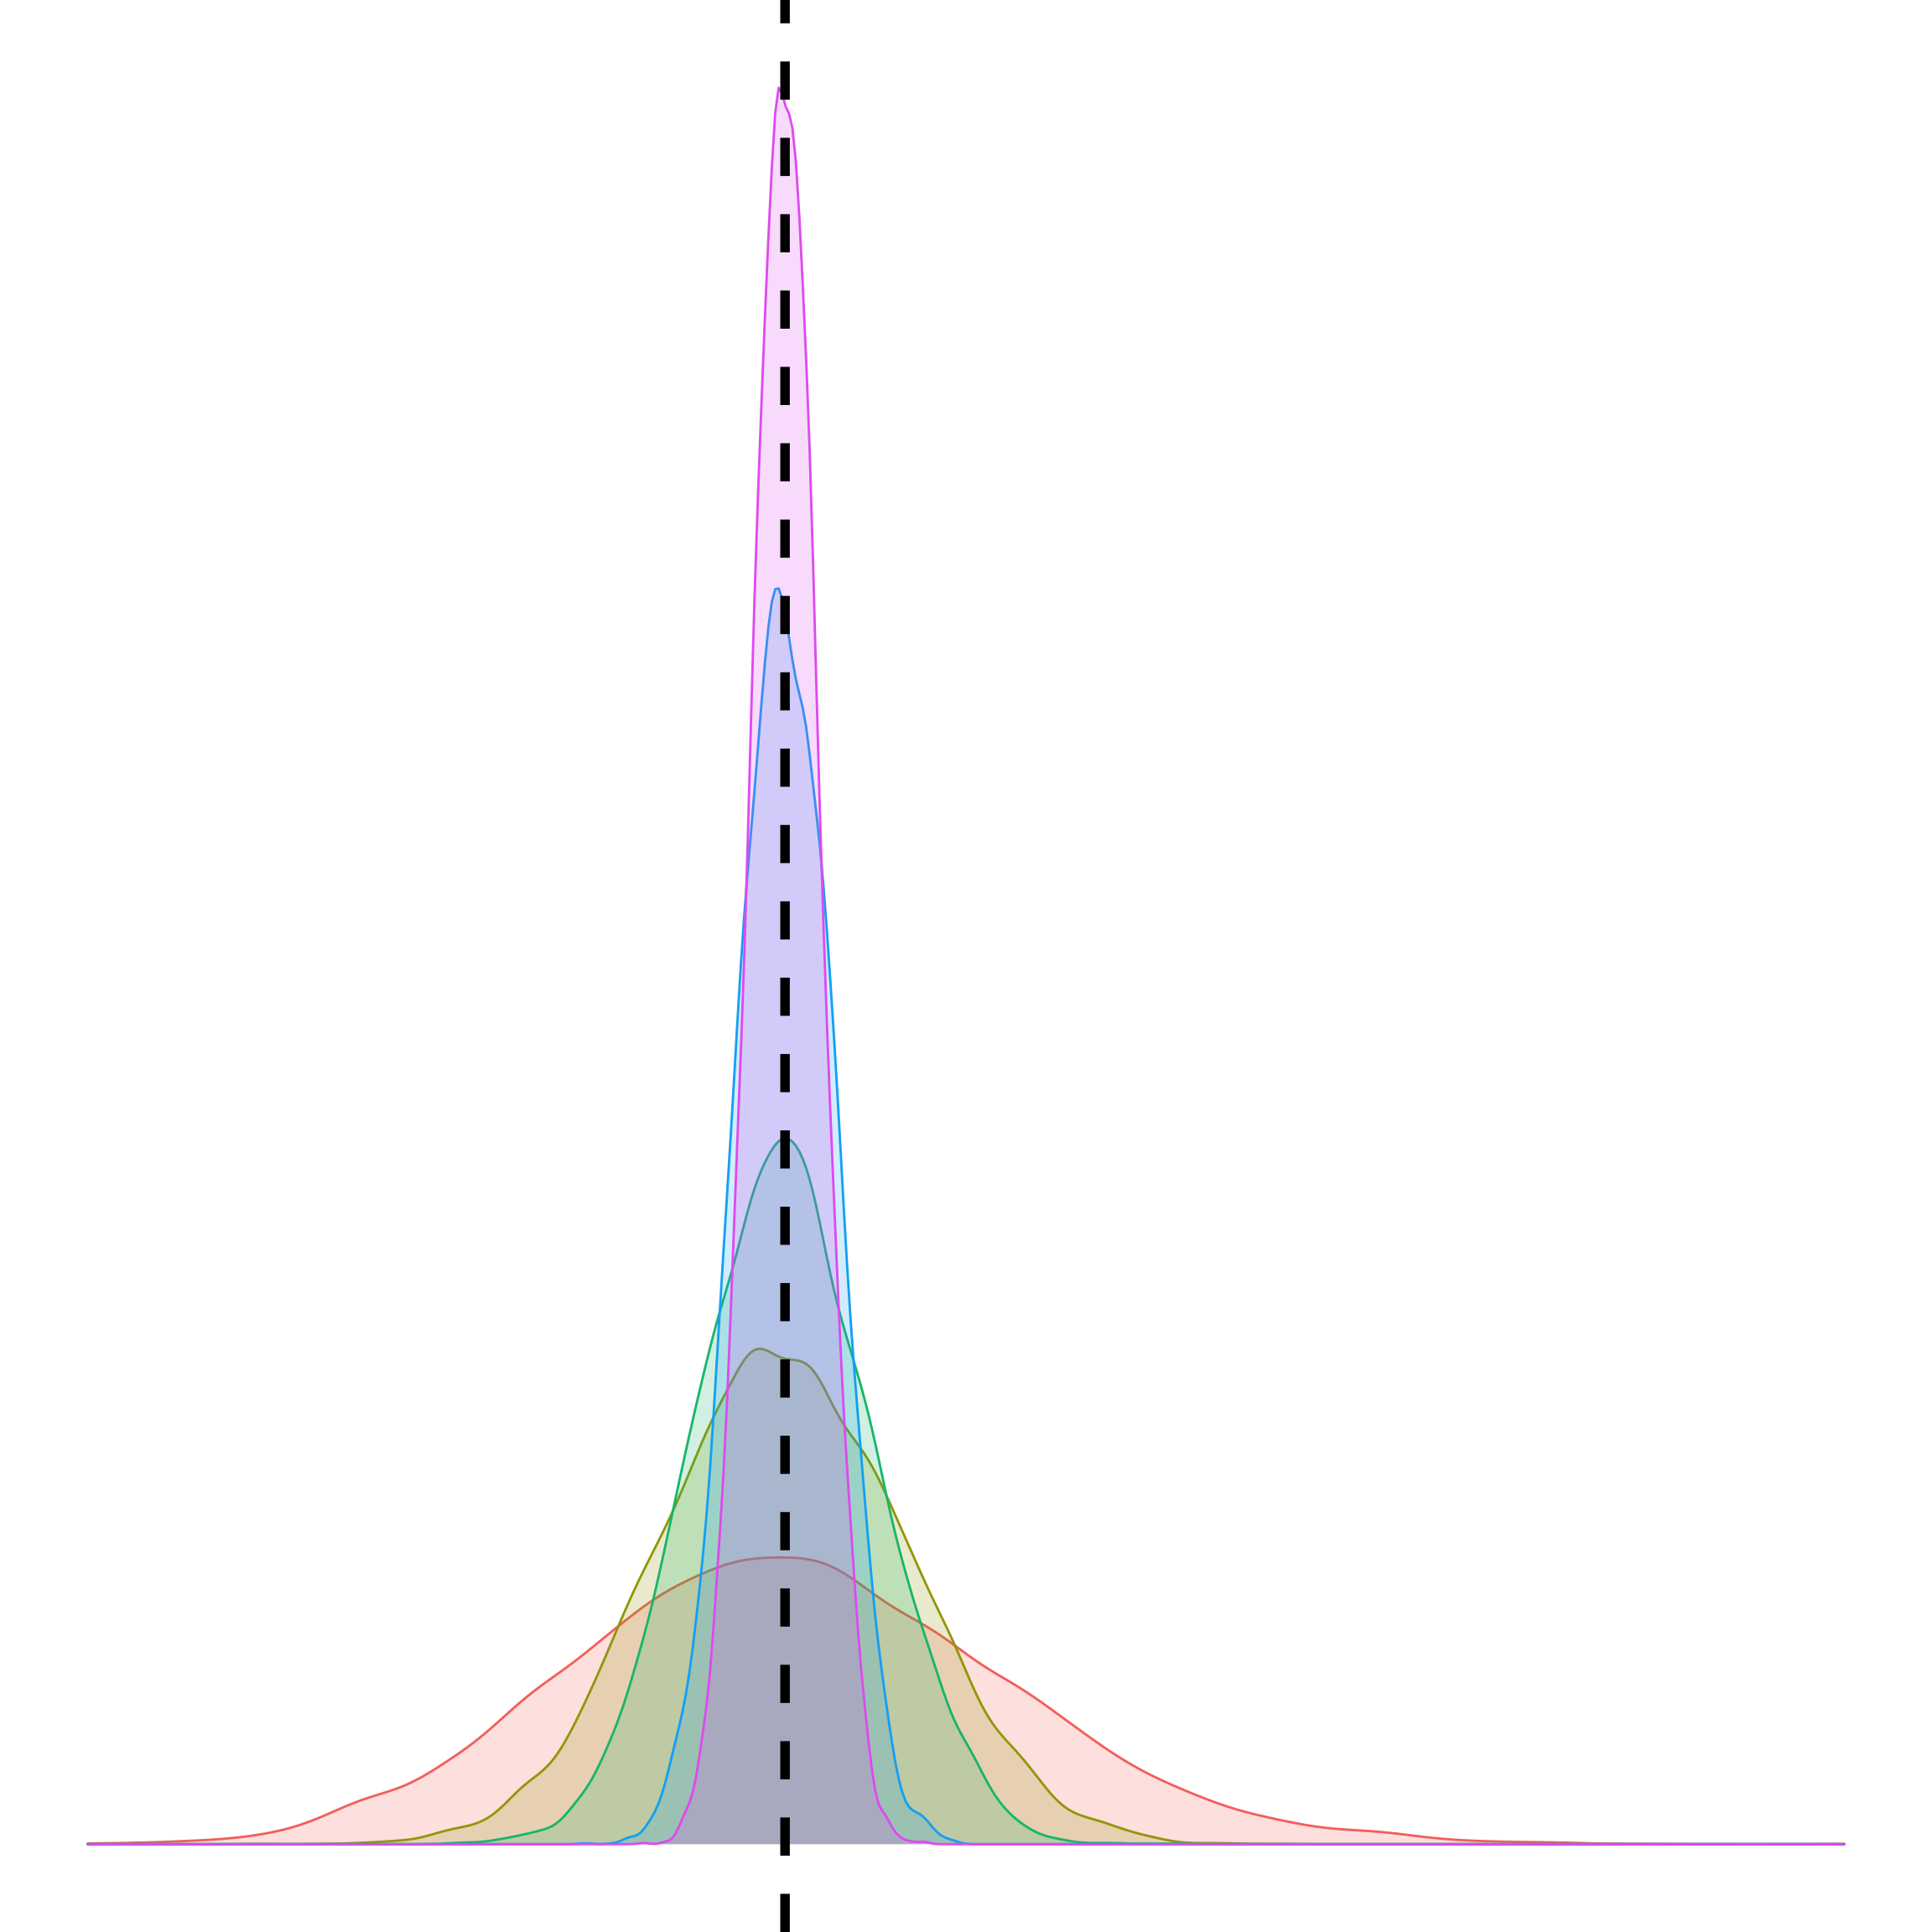
Power Analysis

https://rpsychologist.com/d3/nhst/
Statistical Power: The probability of accepting the alternative hypothesis if it is true.
Power Analysis
https://rpsychologist.com/d3/nhst/
- Effect Size: The strength of a result present in the population.
Power Analysis
https://rpsychologist.com/d3/nhst/
- Effect Size: The strength of a result present in the population.
- Sample Size: The number of observations in the sample.
Power Analysis
https://rpsychologist.com/d3/nhst/
- Effect Size: The strength of a result present in the population.
- Sample Size: The number of observations in the sample.
- Significance: The significance level used in the
Road Map
Data and Sampling
Distributions
Central Limit Theorem
Statistical Significance & Power
Hypothesis Testing

Hypothesis Testing in Statistics
- What hypothesis does statistics test?
- How does this fit into the Scientific Method?
One-Sided Hypothesis Test
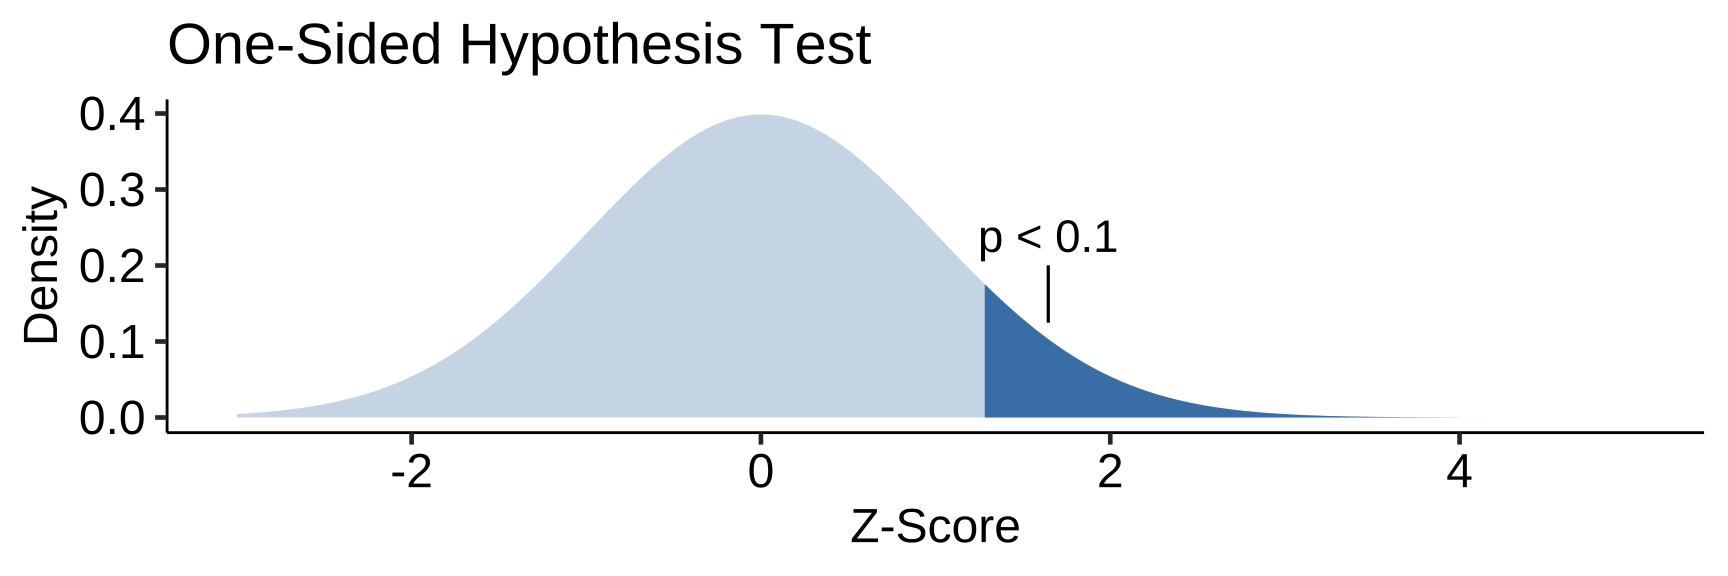
- One-Sided/One-Tailed: p differs from one direction (and not the other)
Two-Sided Hypothesis Test
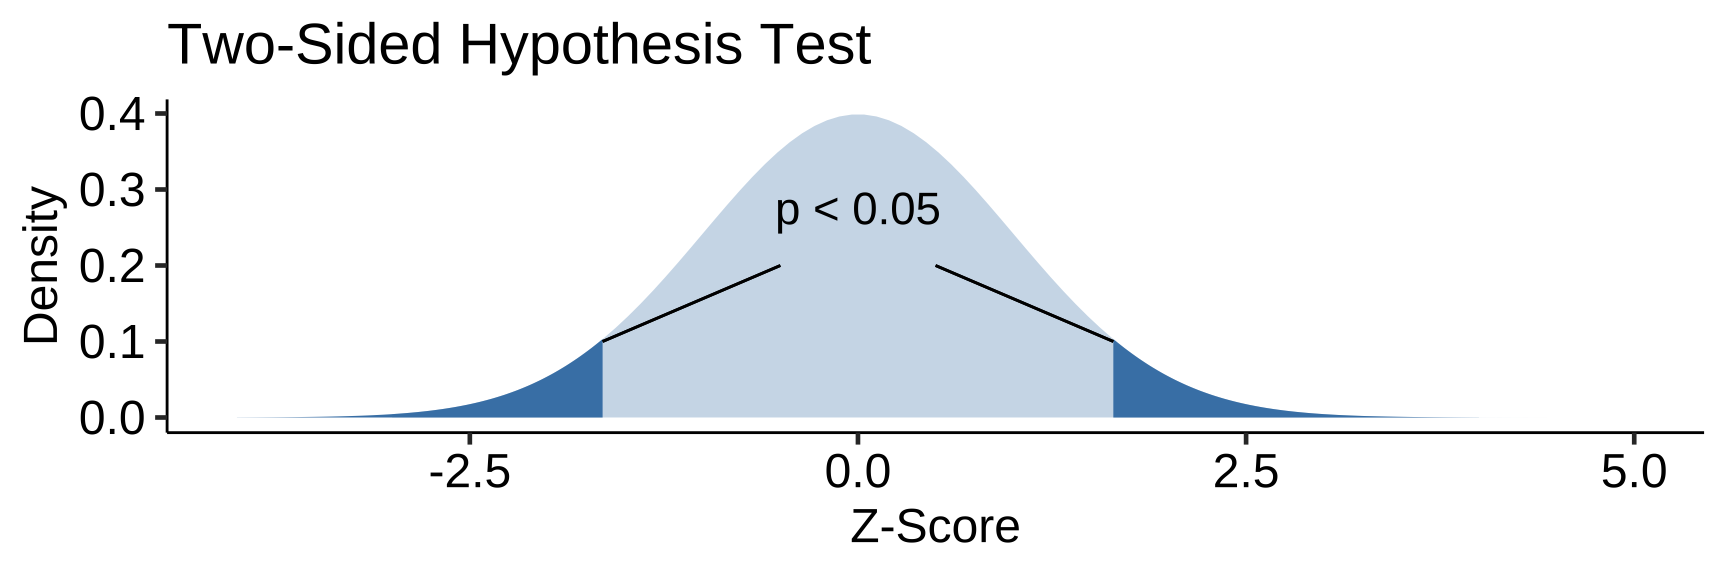
- Two-Sided/Two-Tailed: p differs from either the left or right
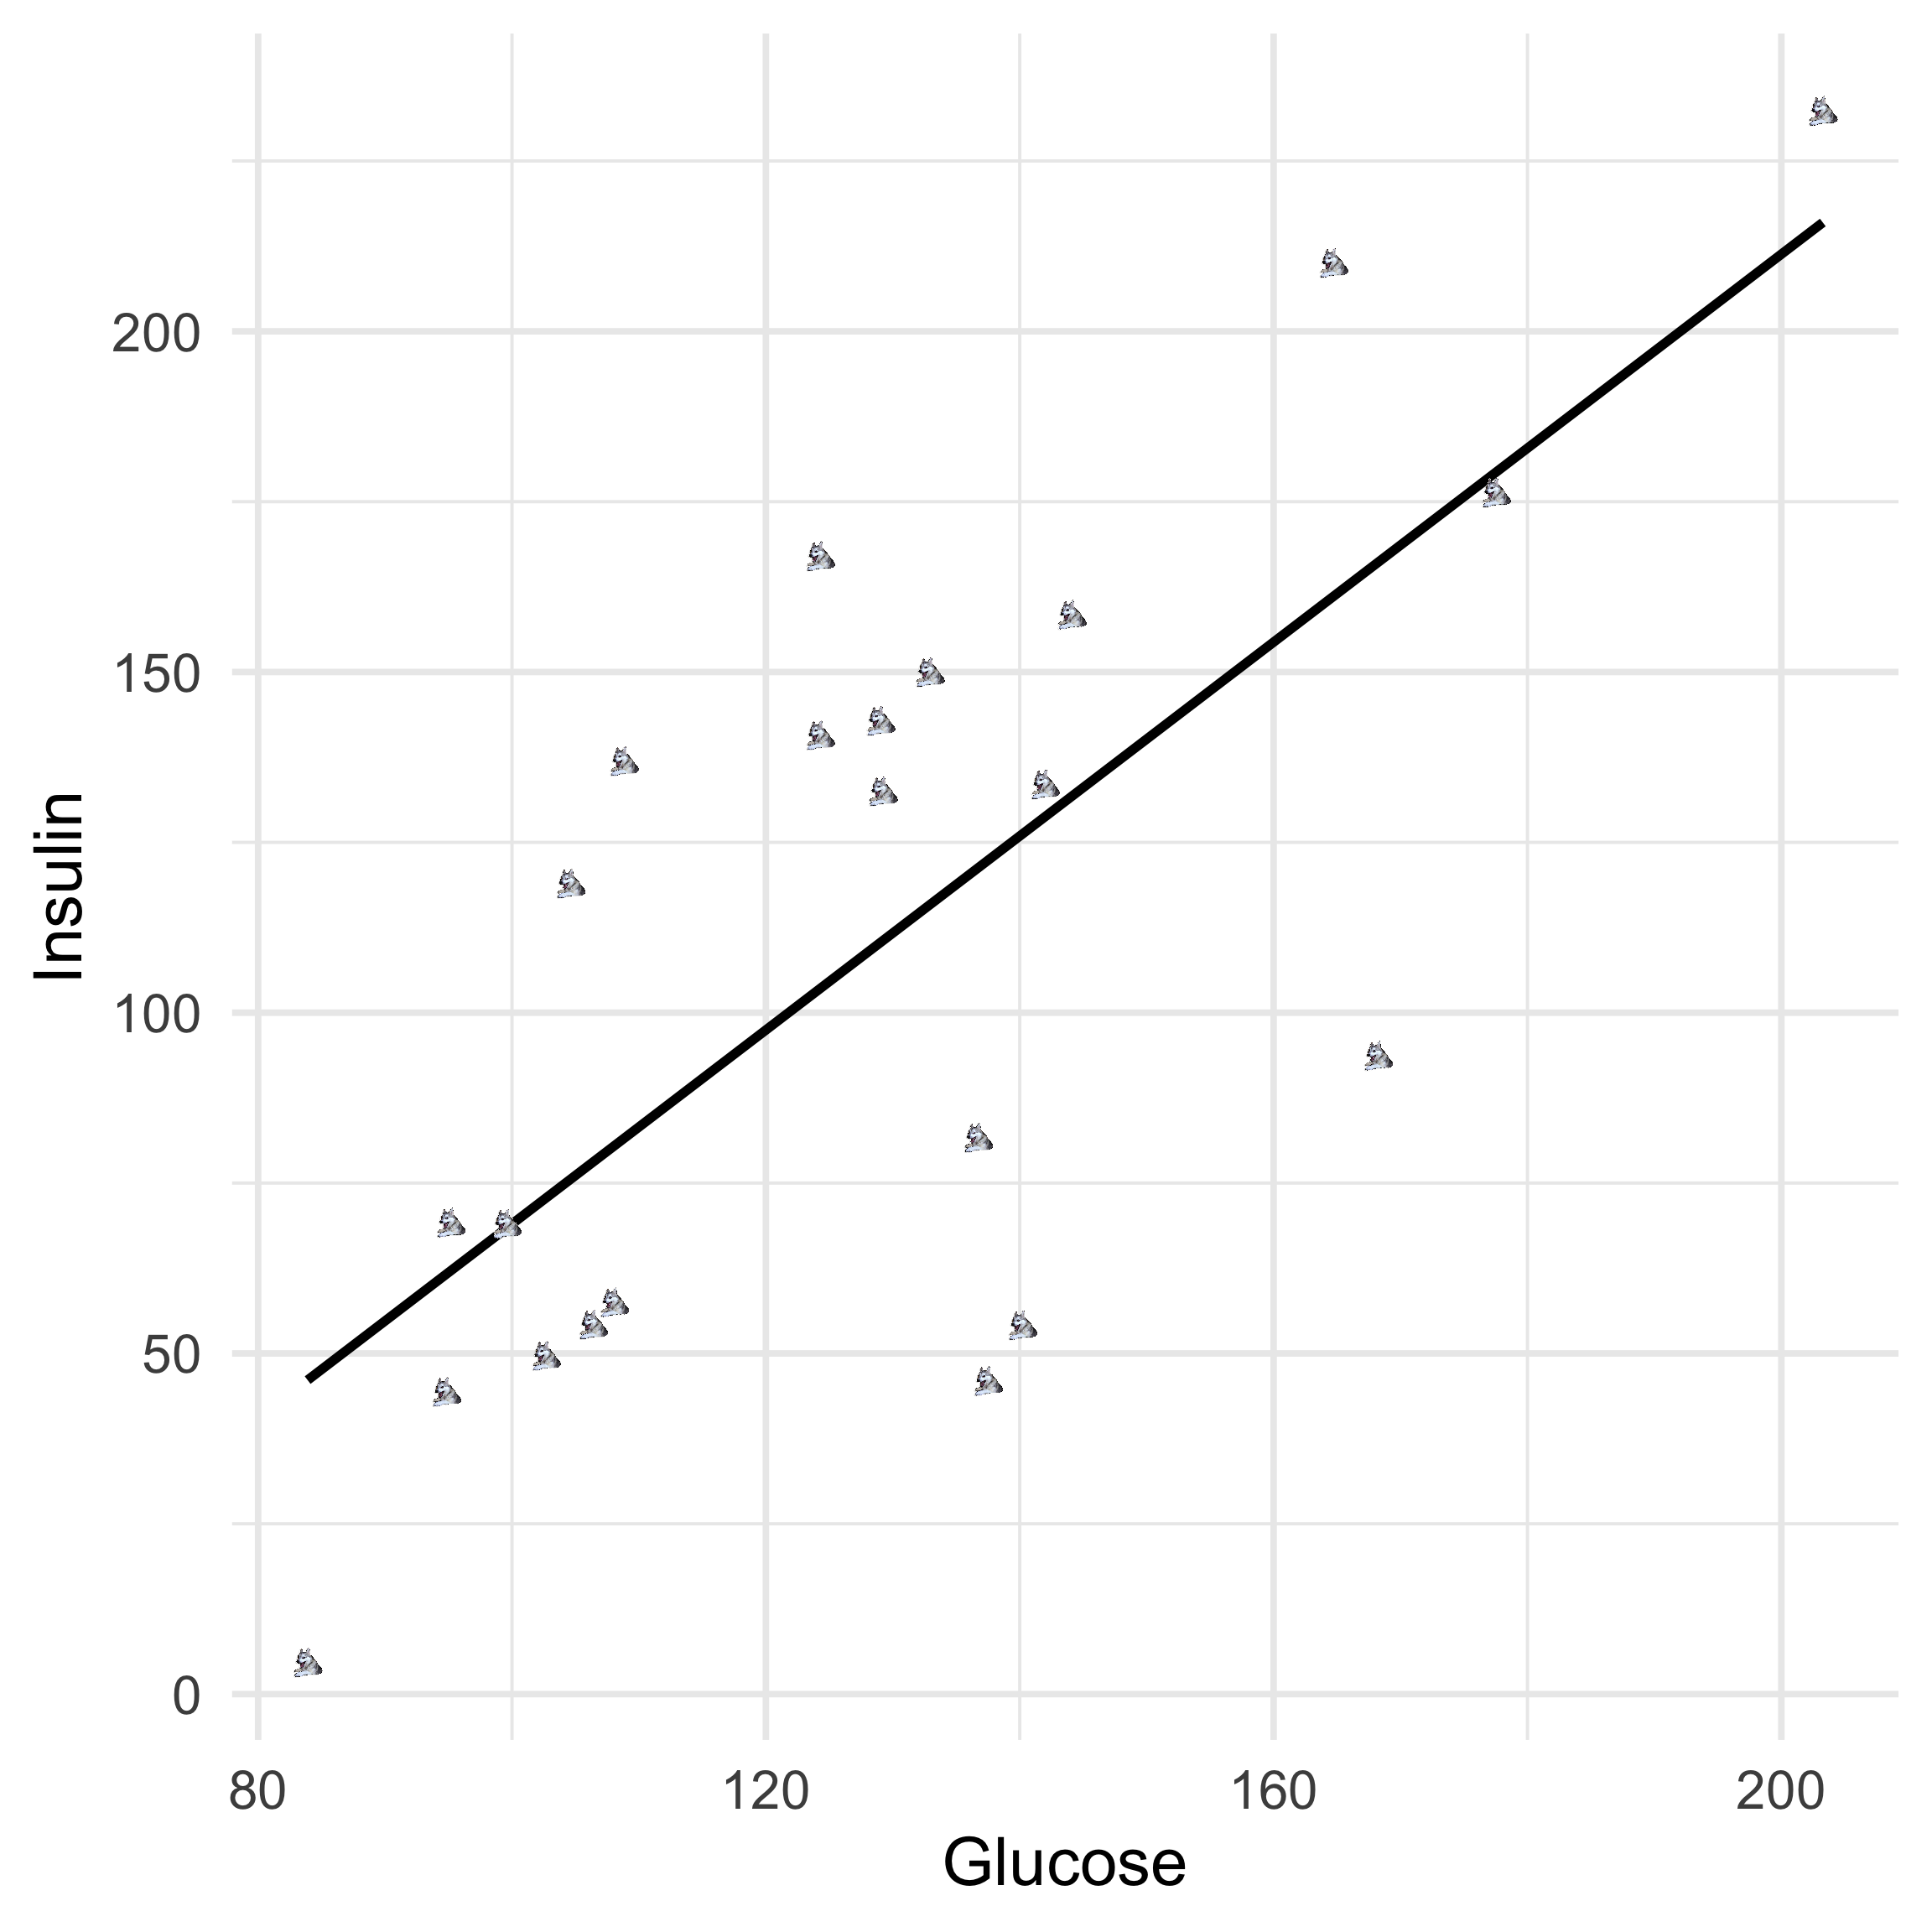
Linear Regression
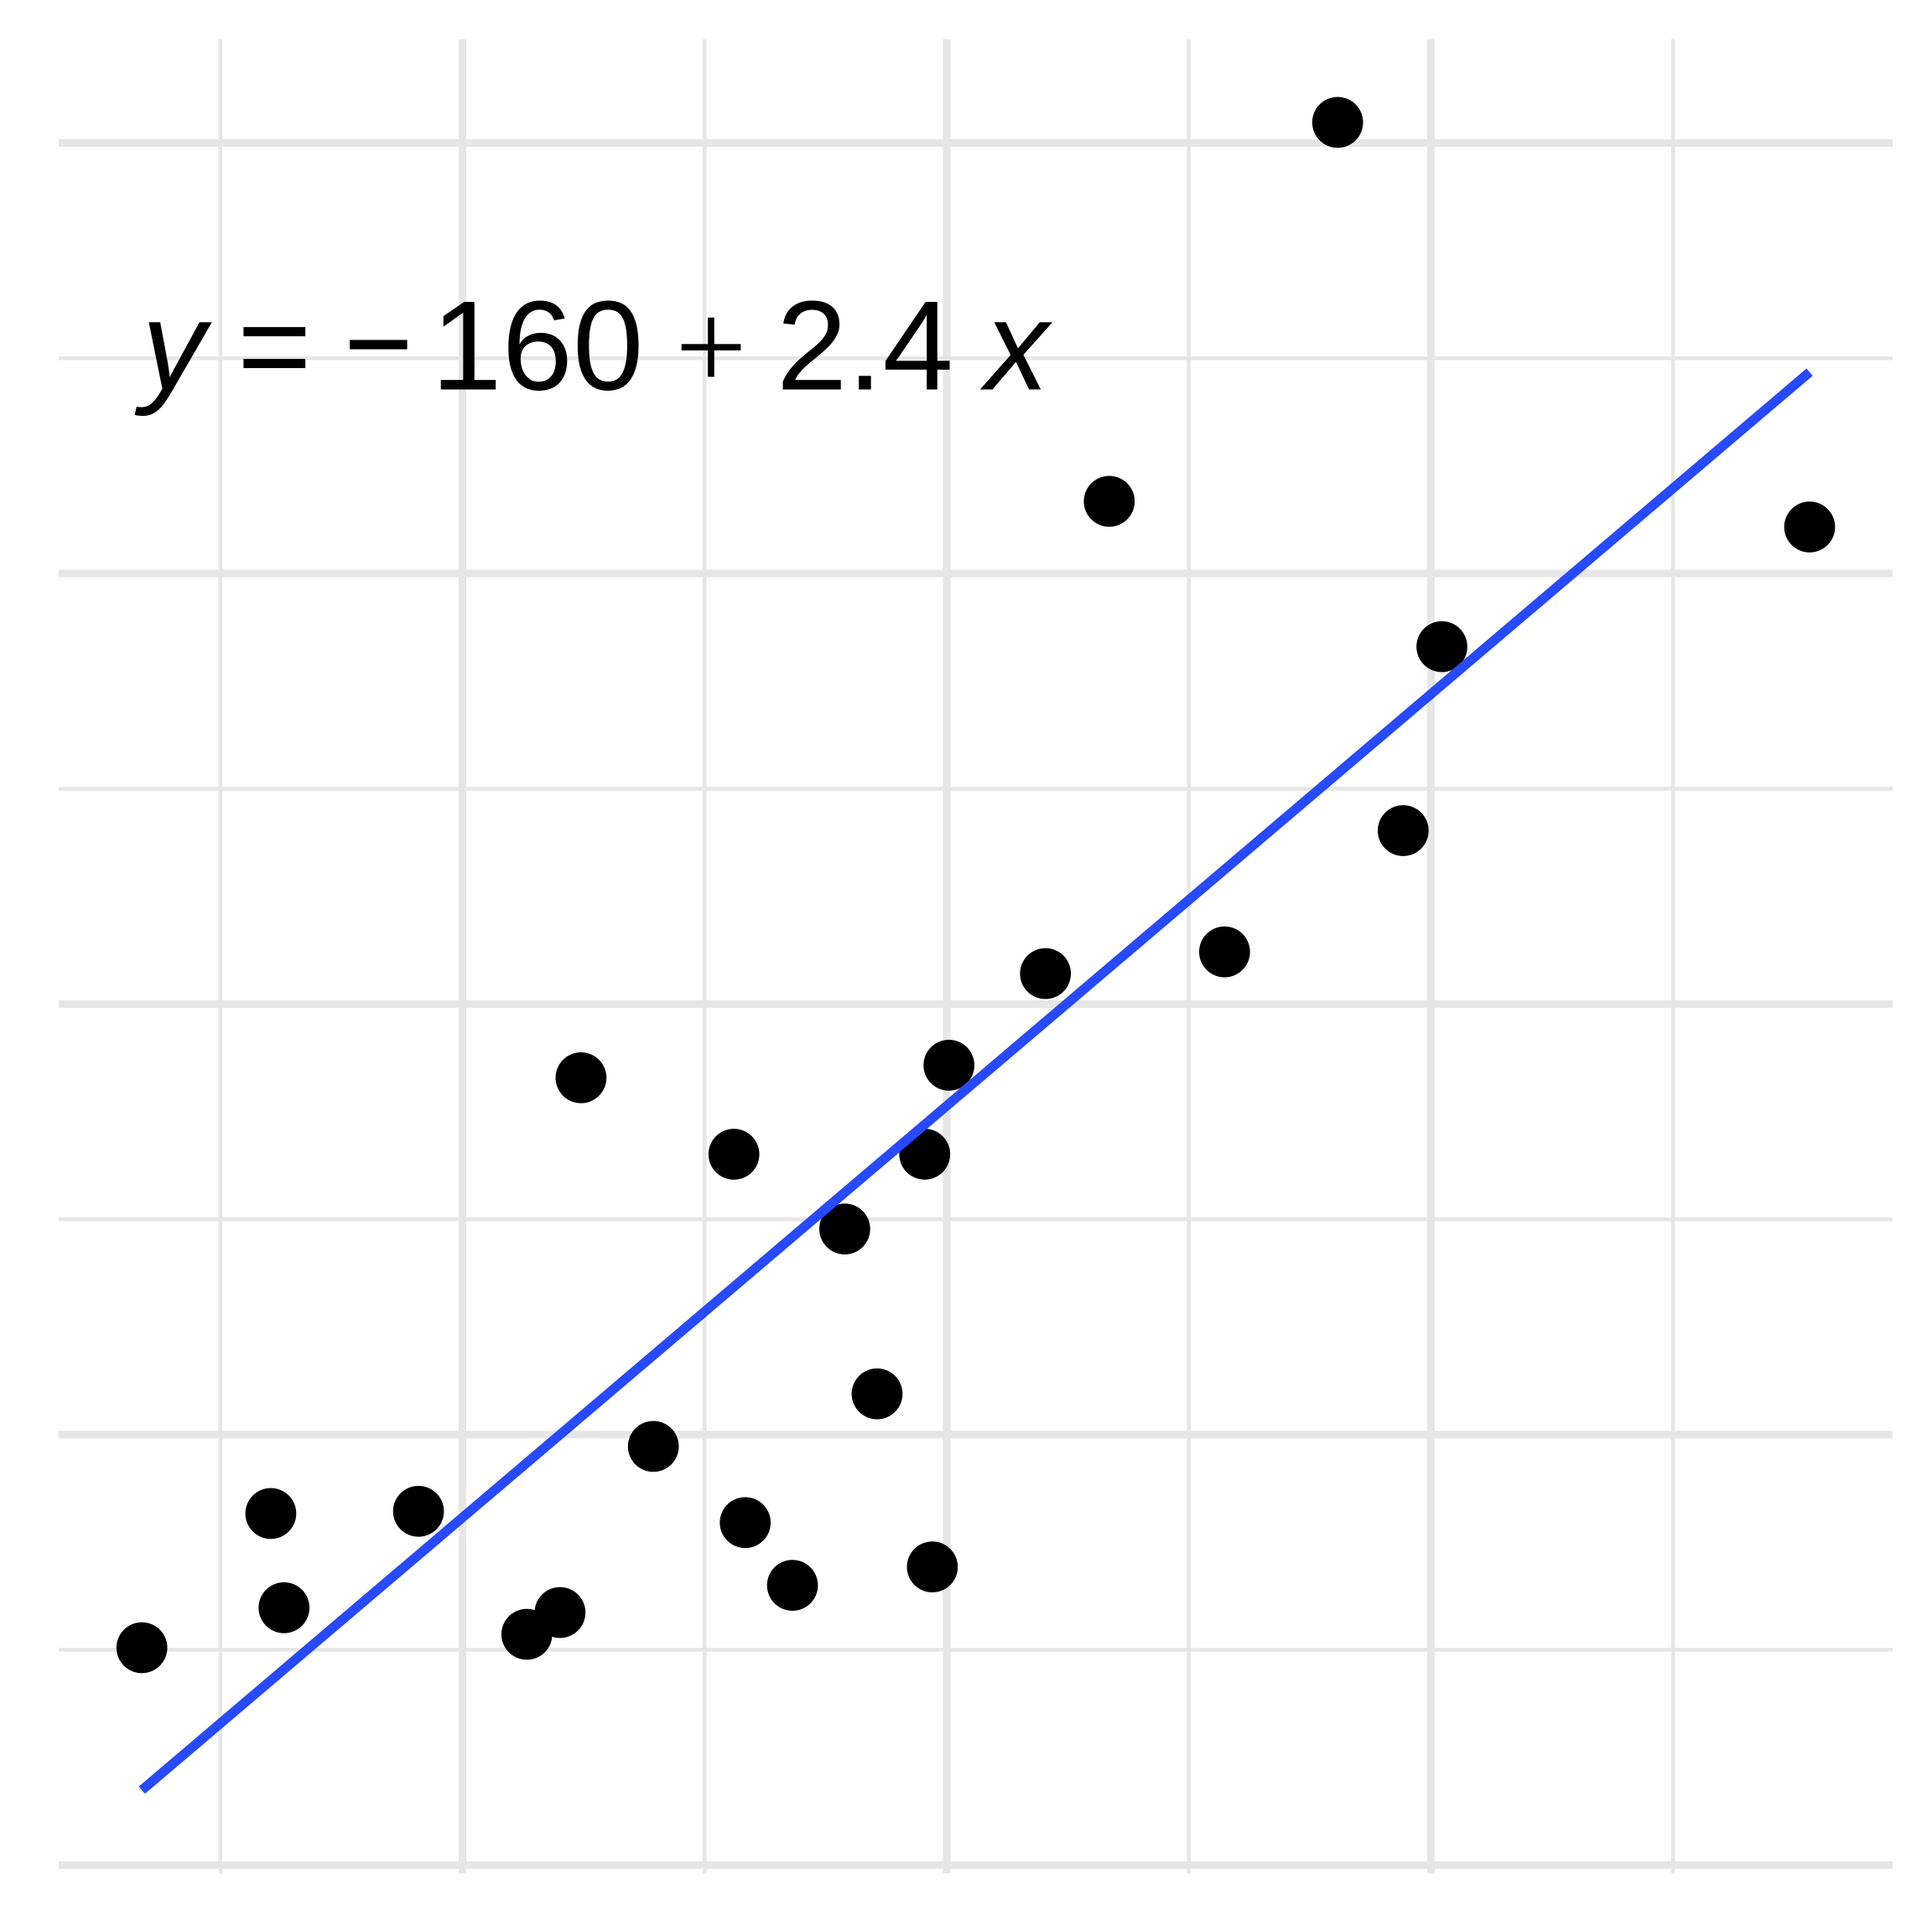
- Relationship between numerical variables
- \(y = \beta x + y_i\)
- \(\beta\) is the slope
- \(y_i\) is the y-intercept
Linear Regression: Residuals
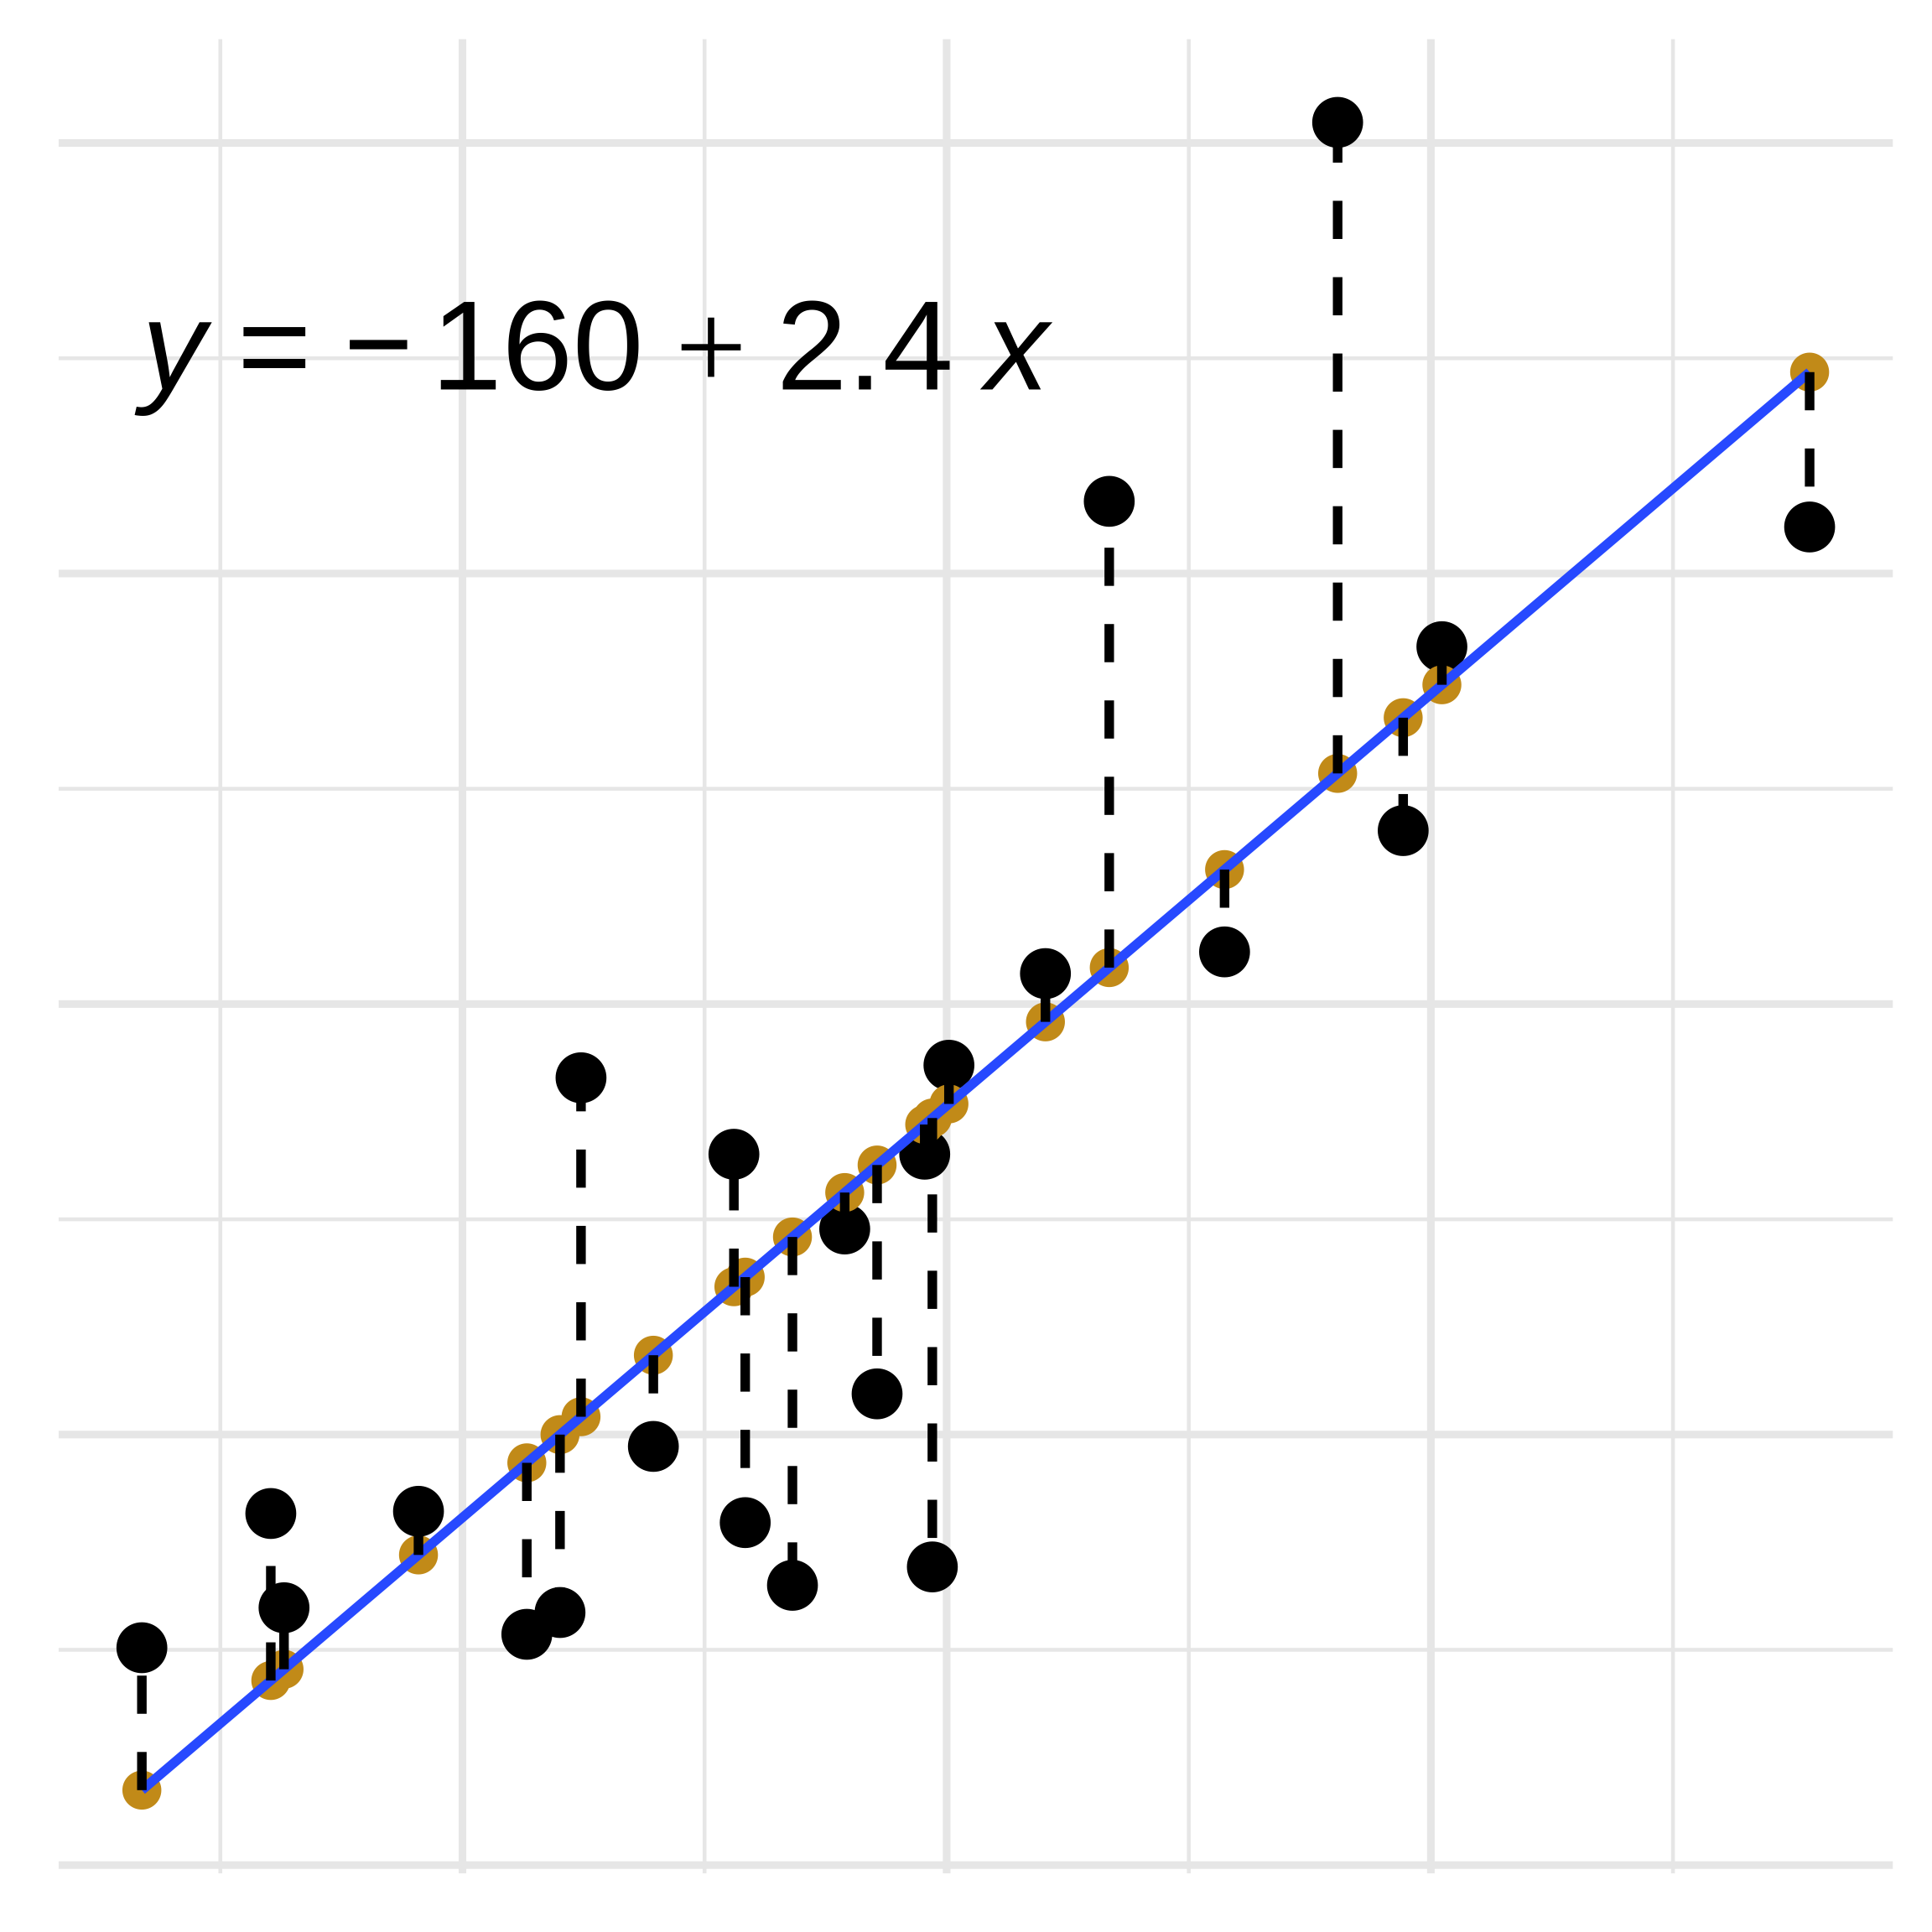
- Residuals: \(r\)
- Actual value: \(y\)
- Predicted value (on the line): \(y_0\)
- Formula: \(r = y-y_0\)
- Smaller residuals = better model fit
Linear Regression: Model Fit
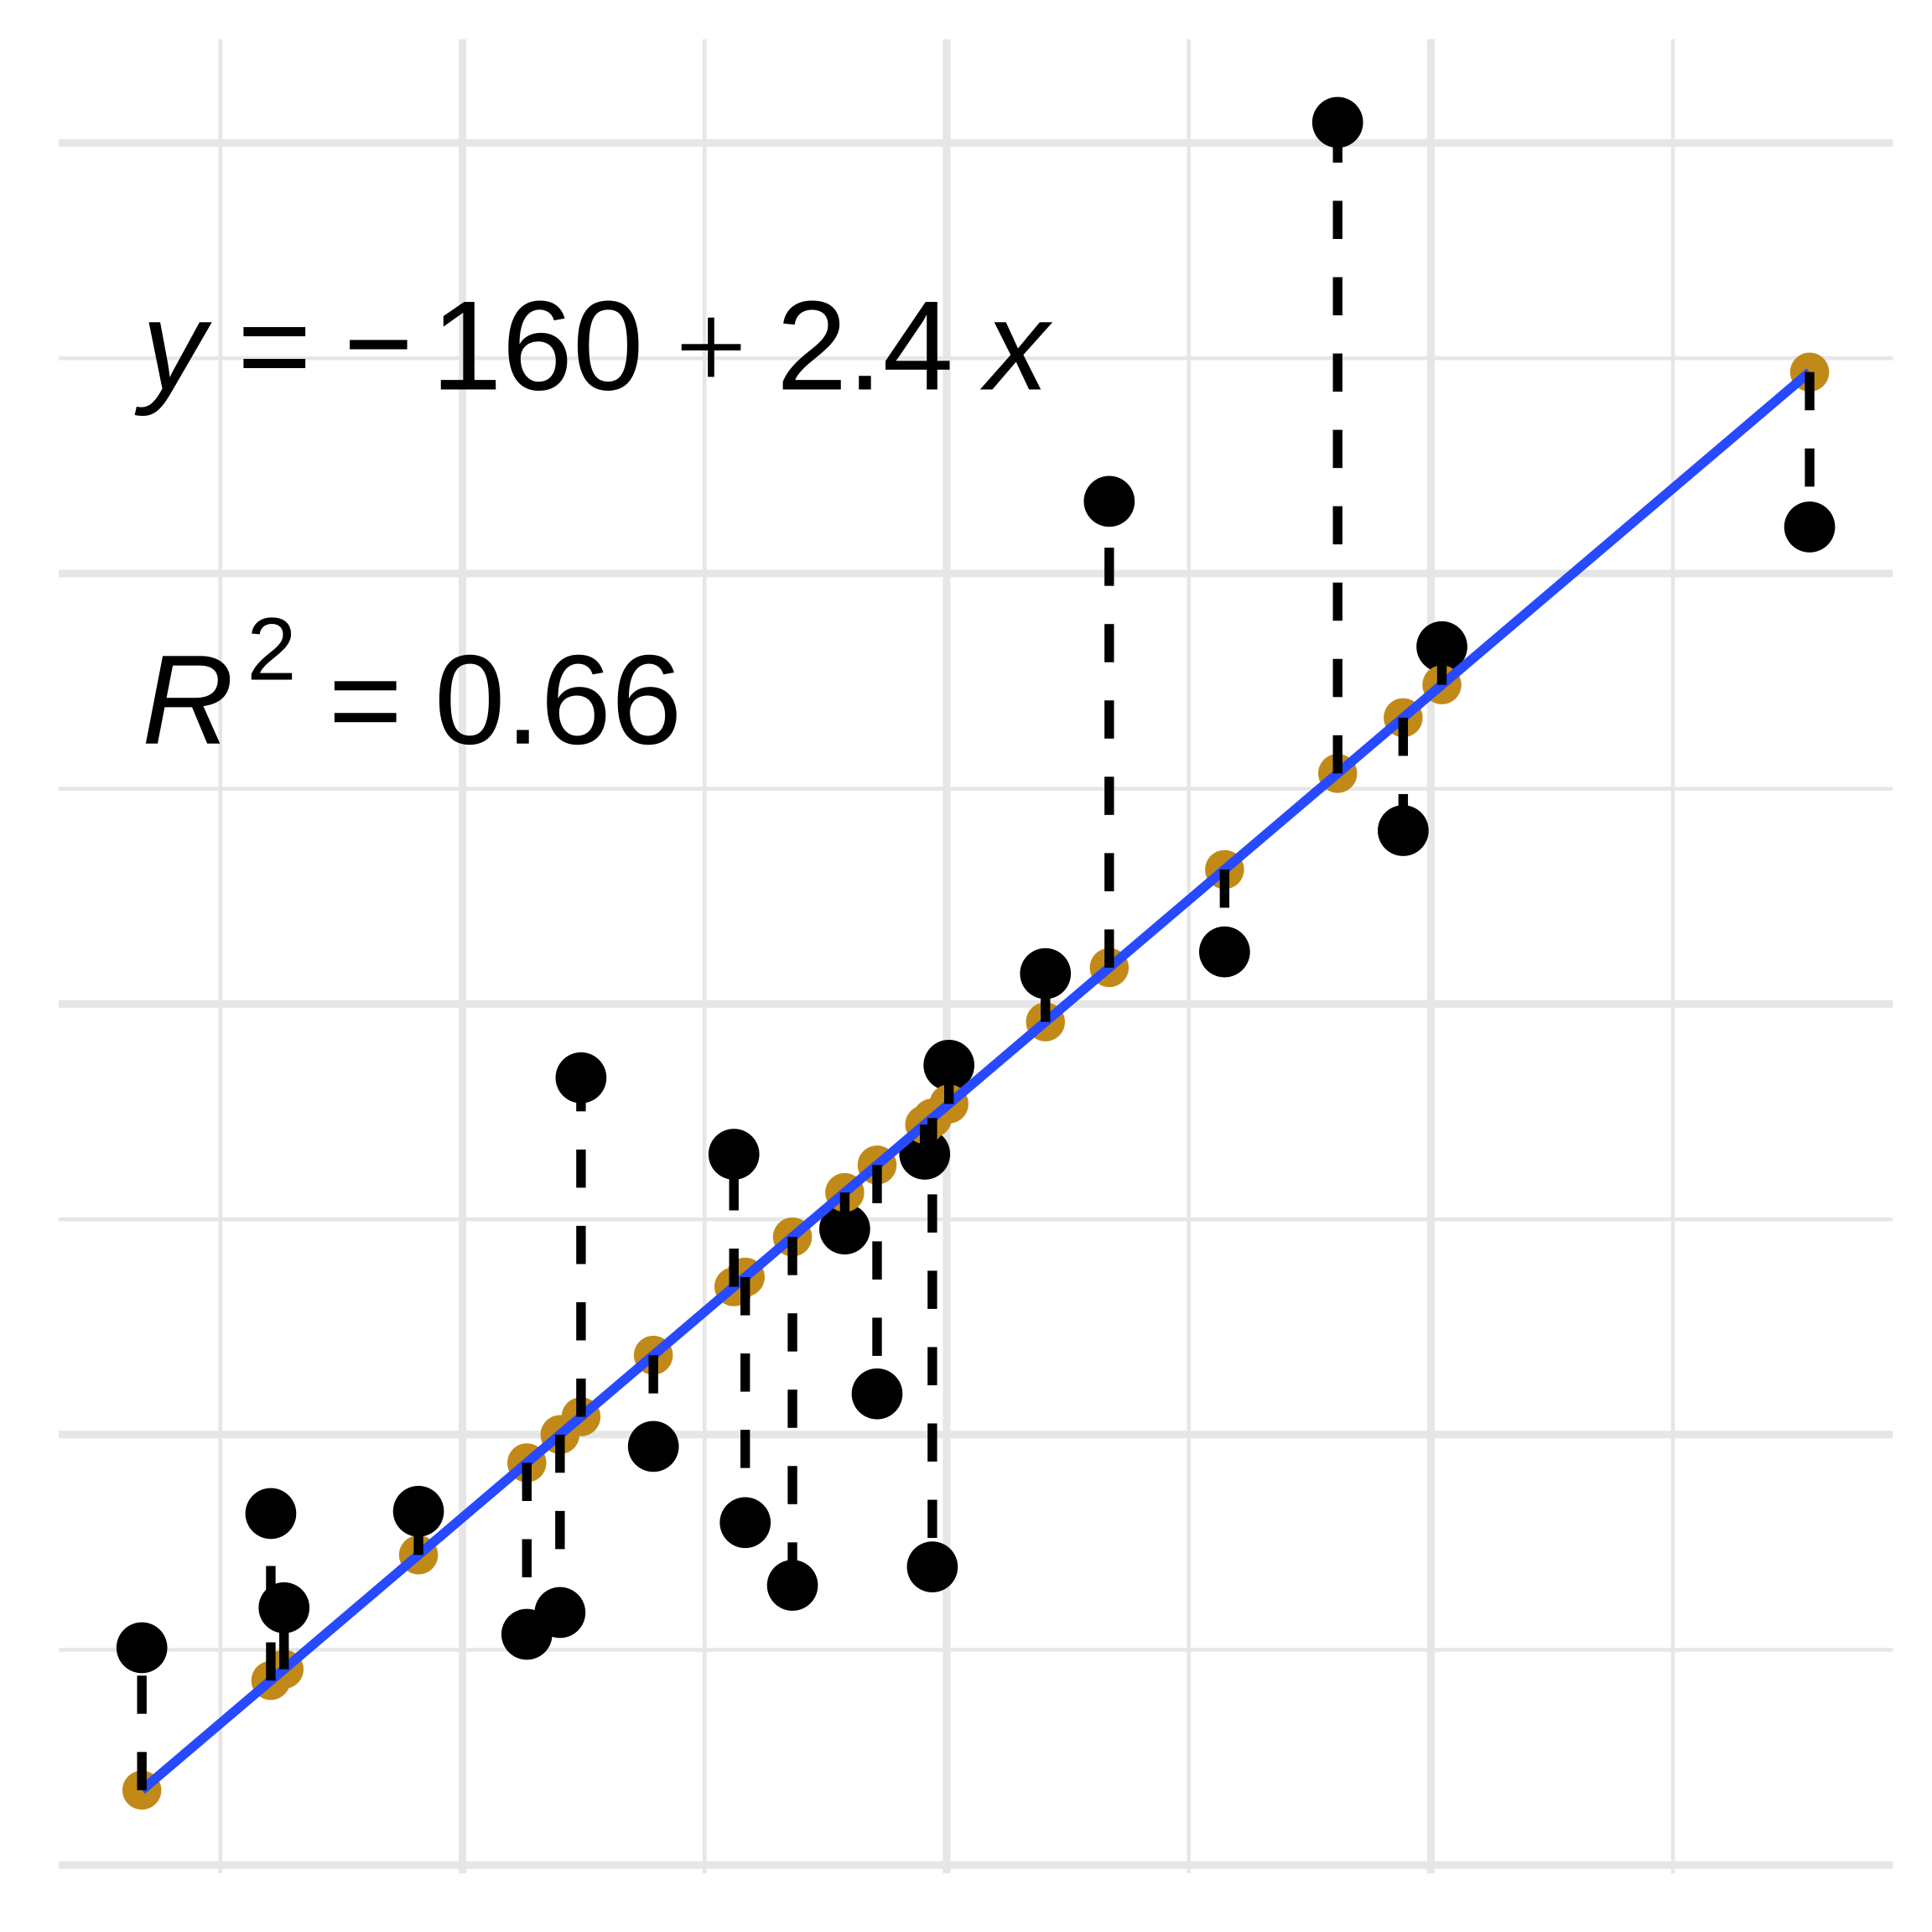
- Model Fit: \(R^2\)
- Mean of the response variable: \(\bar{y}\)
- Sum of Squares Regression: \((y-\bar{y})^2\)
- Sum of Squares Total: \((y_0-\bar{y})^2\)
- \(R^2 = 1- \frac{(y-\bar{y})^2} {(y_0-\bar{y})^2}\)
Linear Regression: Model Fit
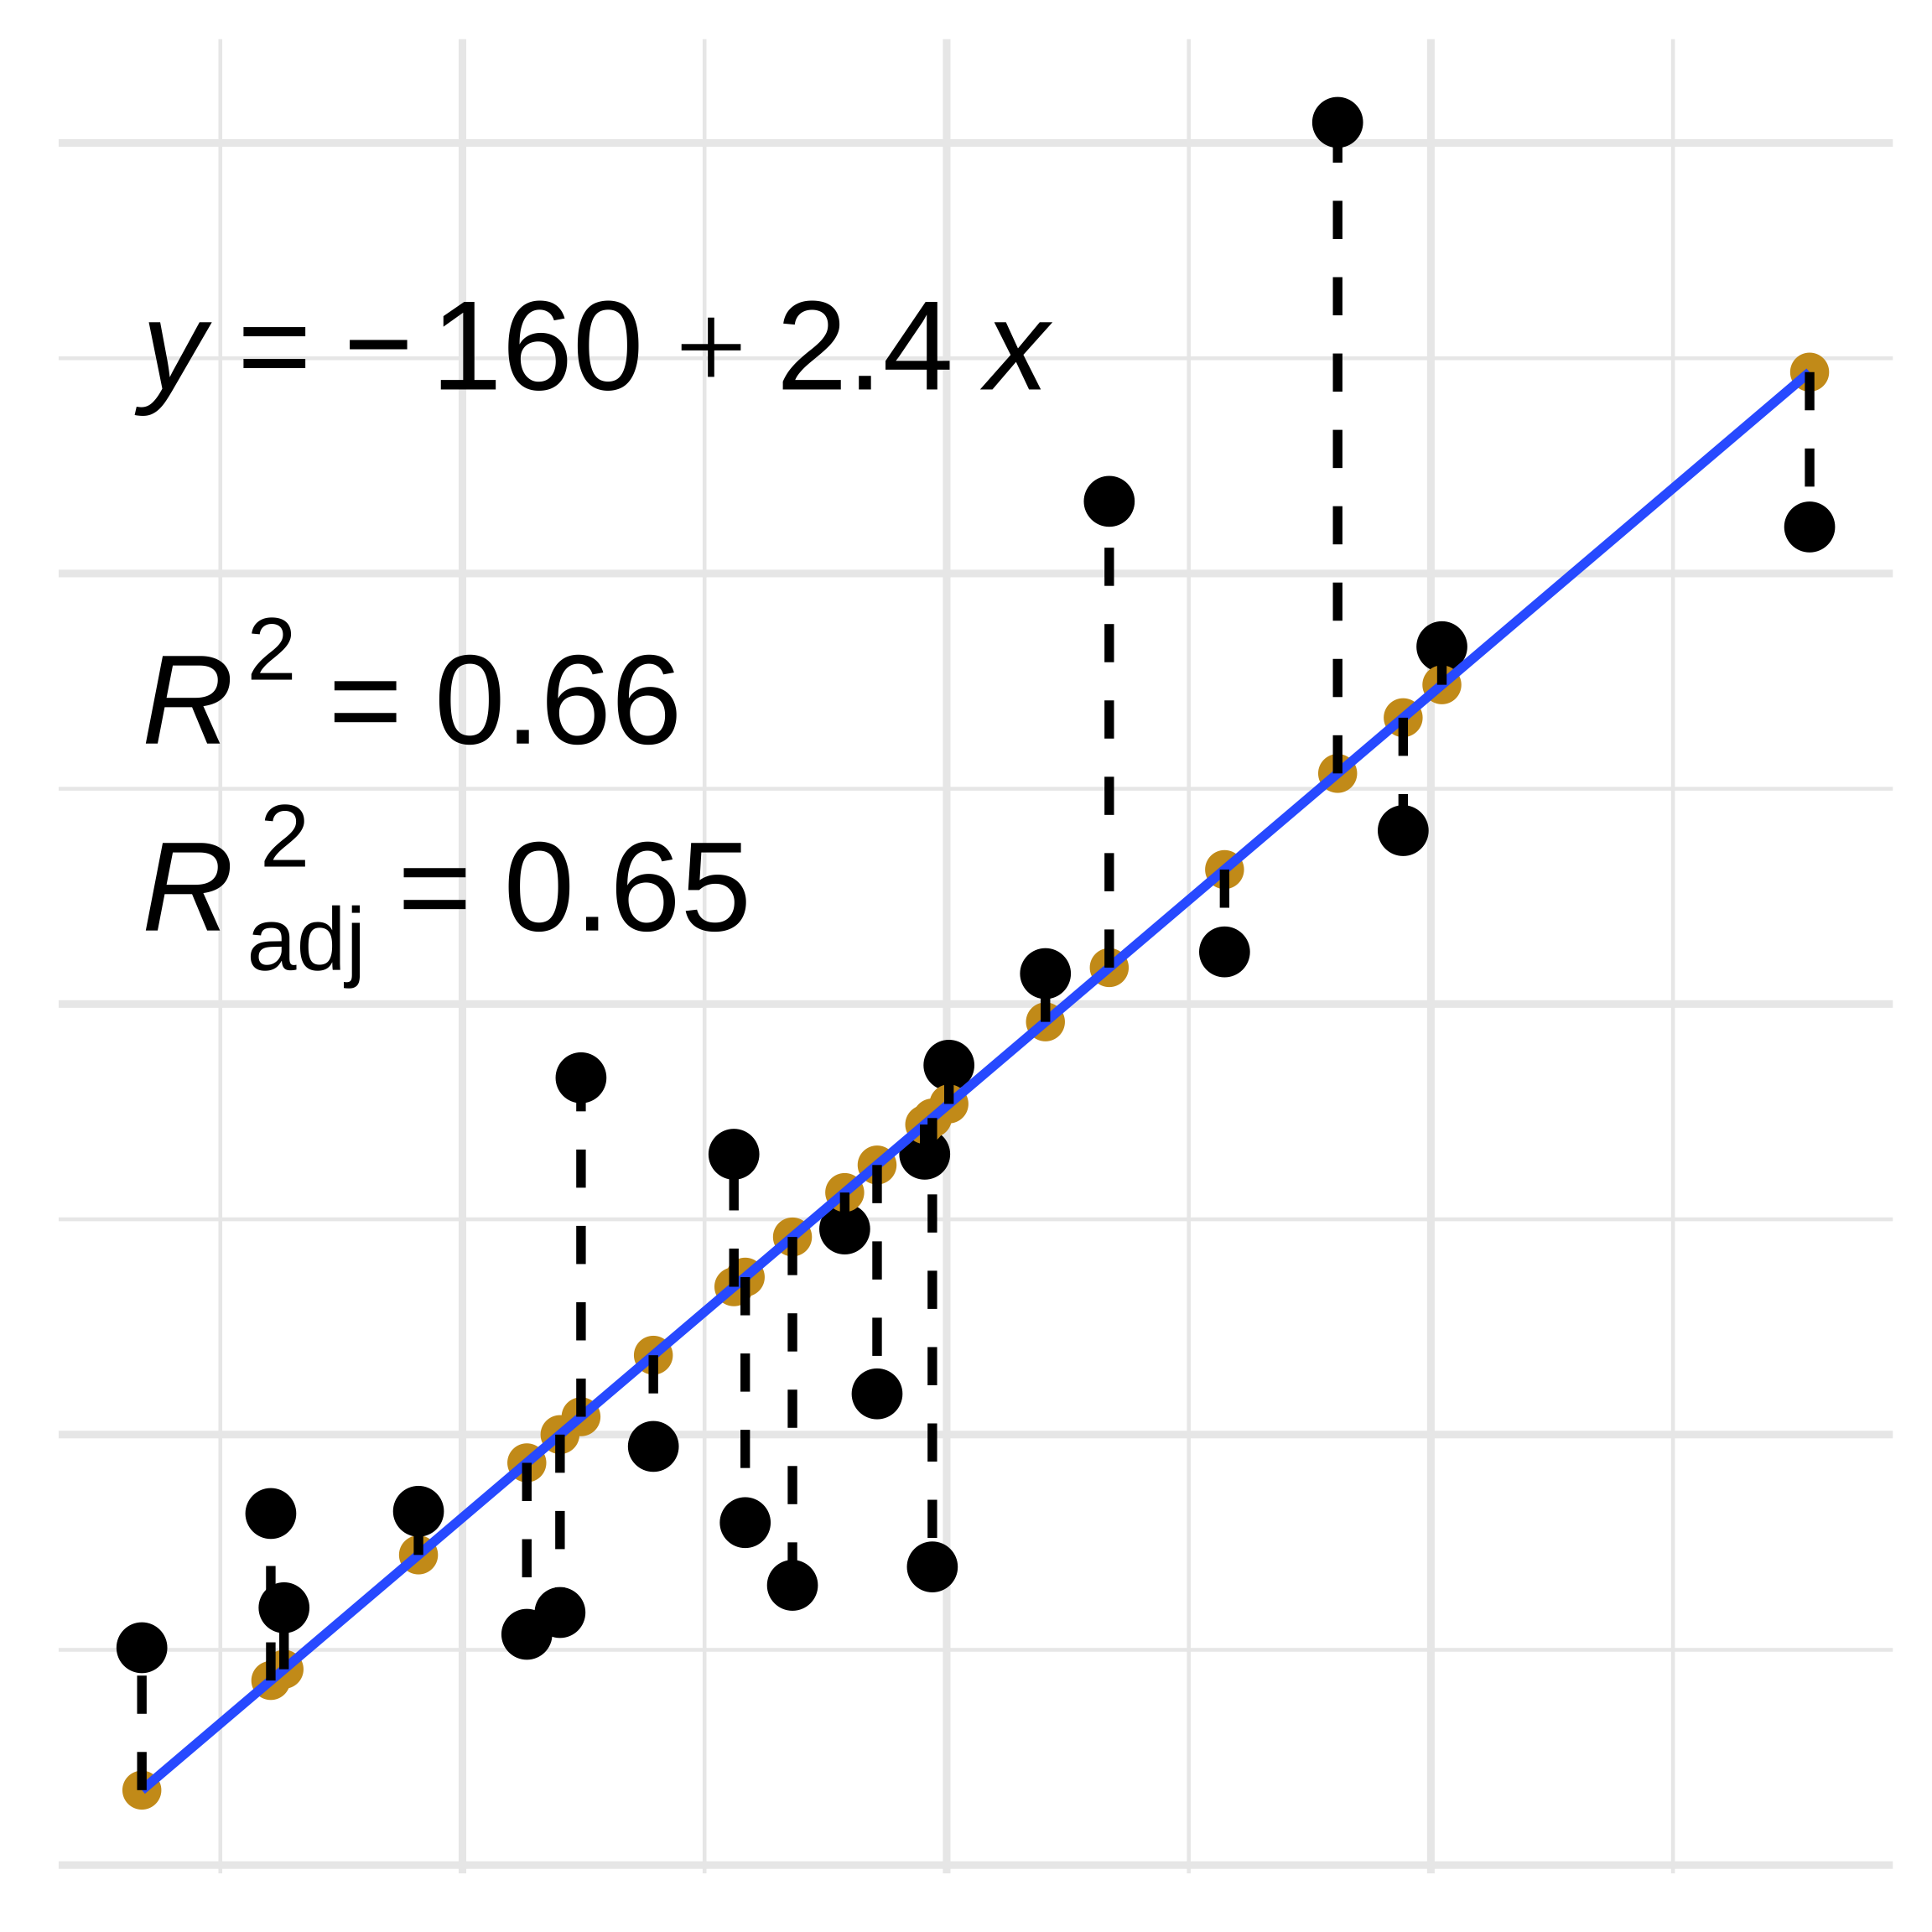
- \(R^2_{adj}\) penalizes based on the number of predictor variables
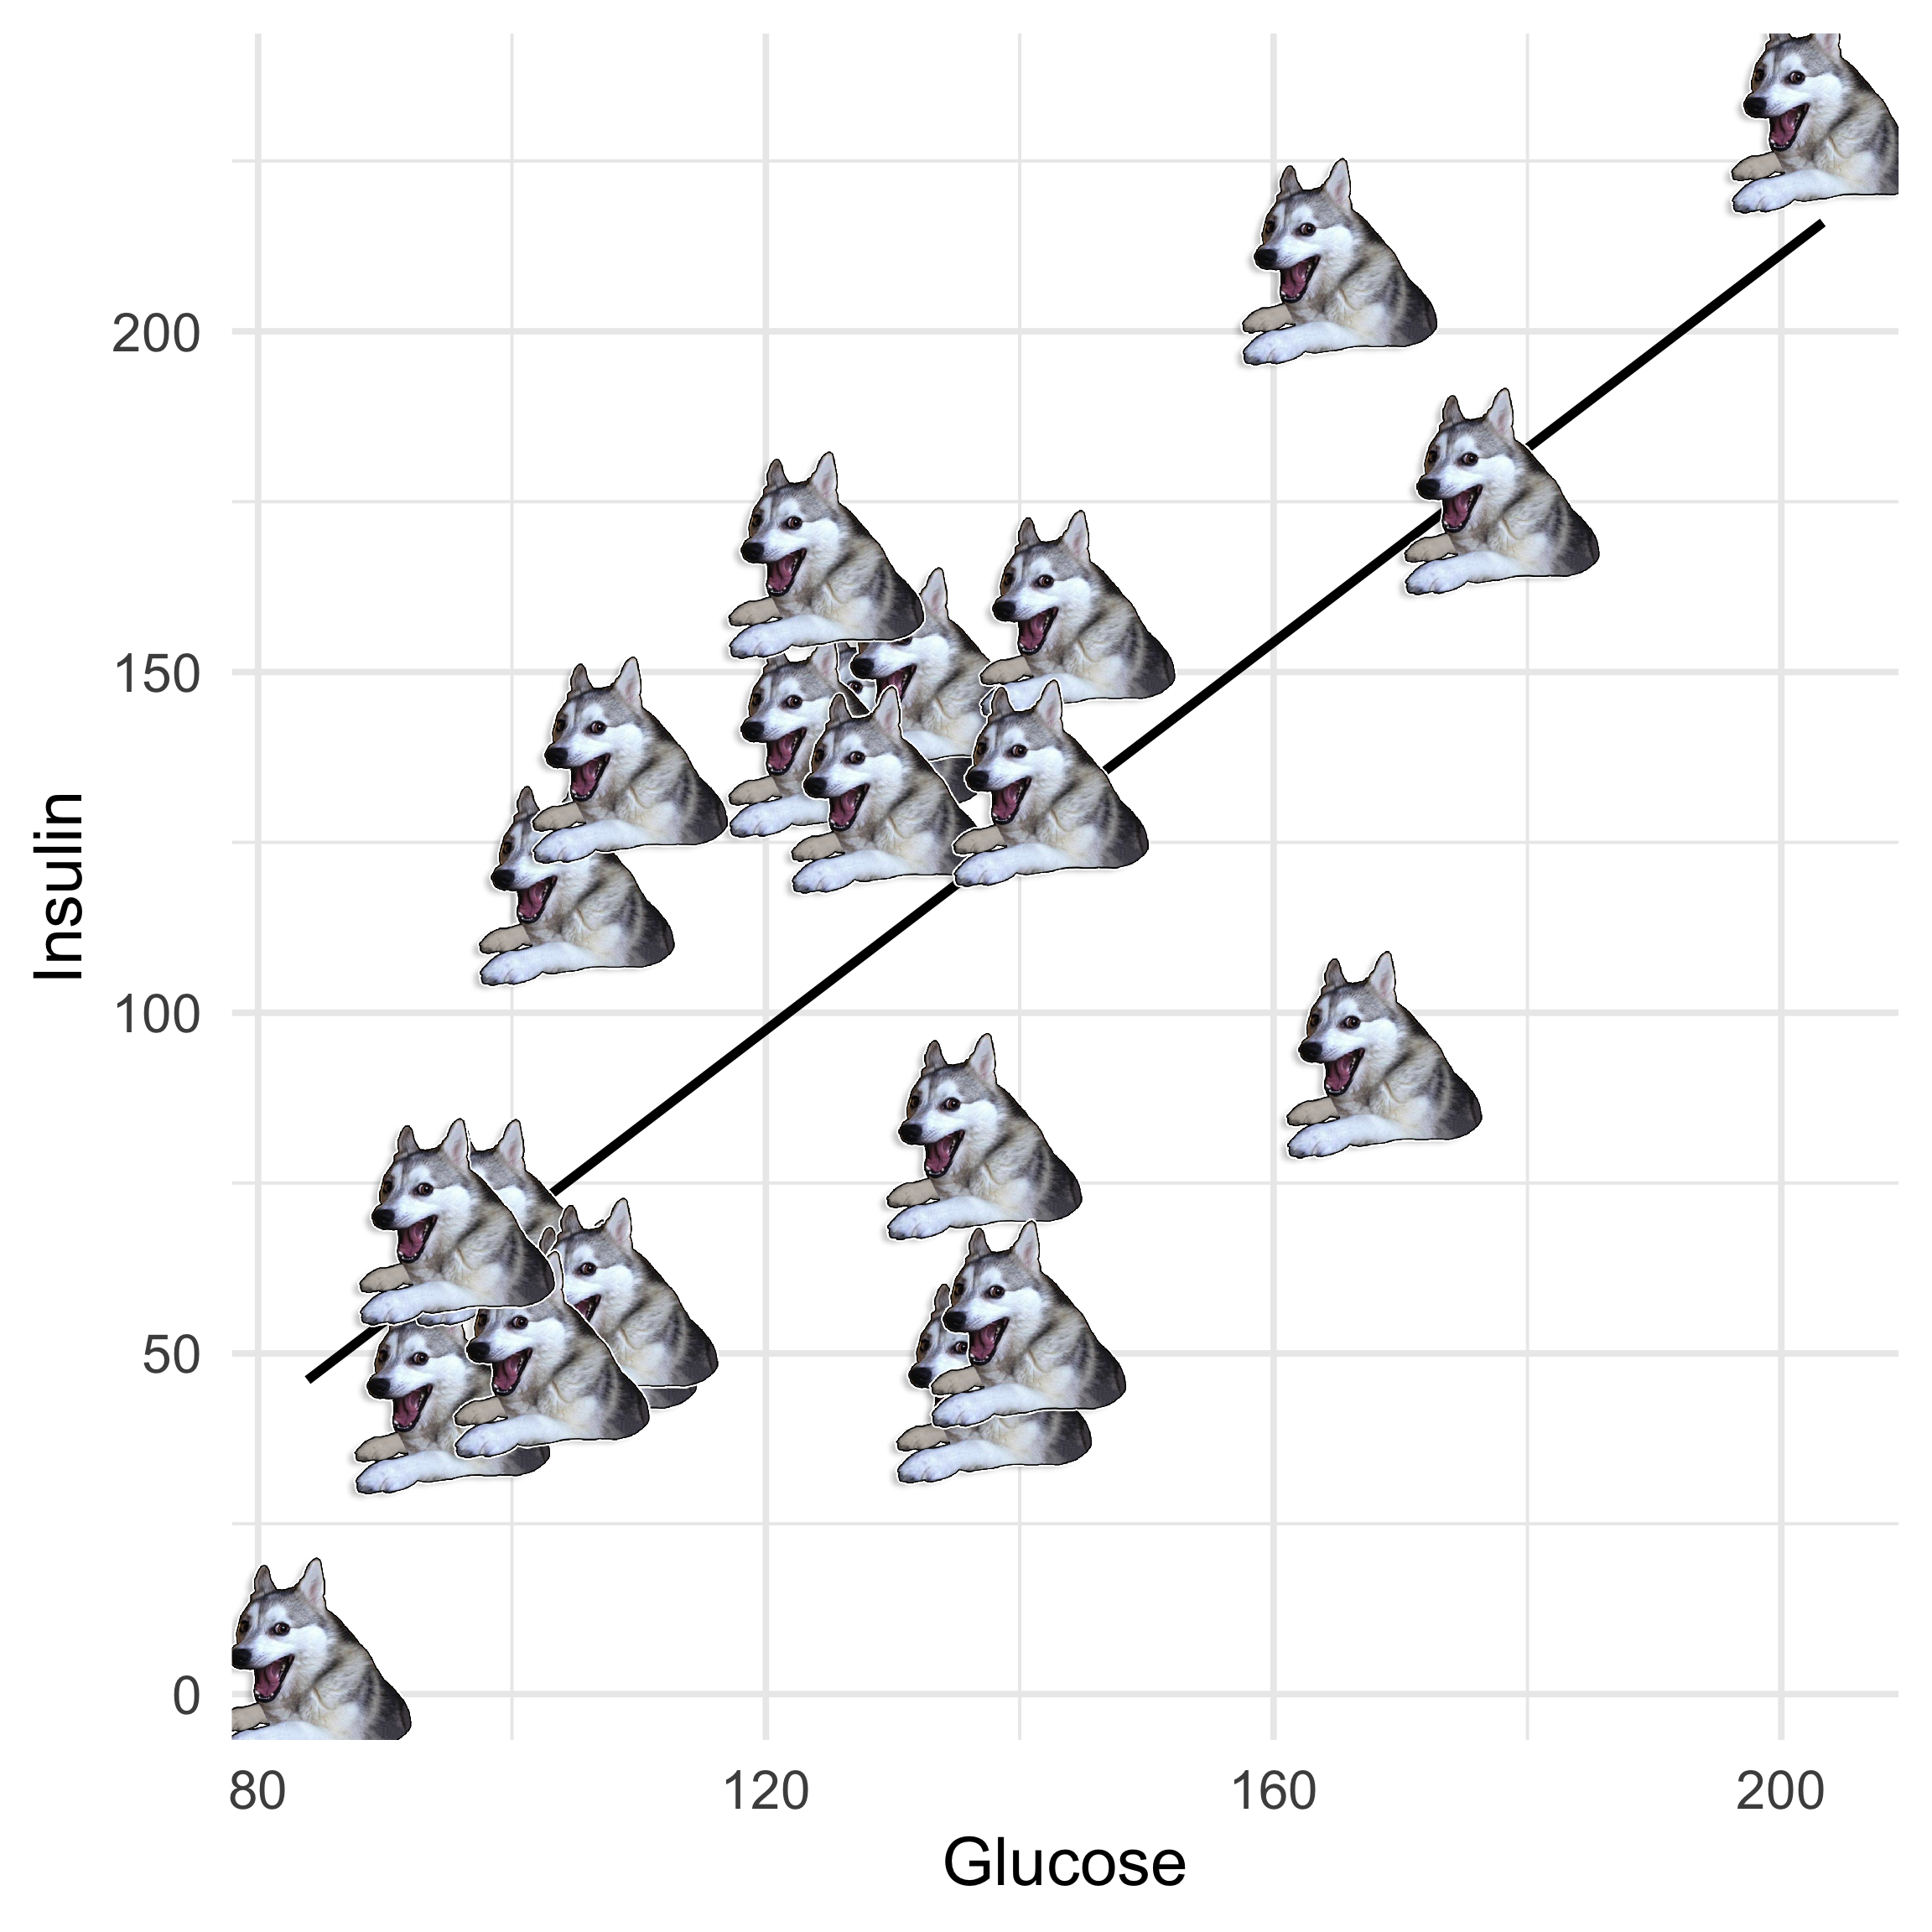
Linear Regression: Extrapolation
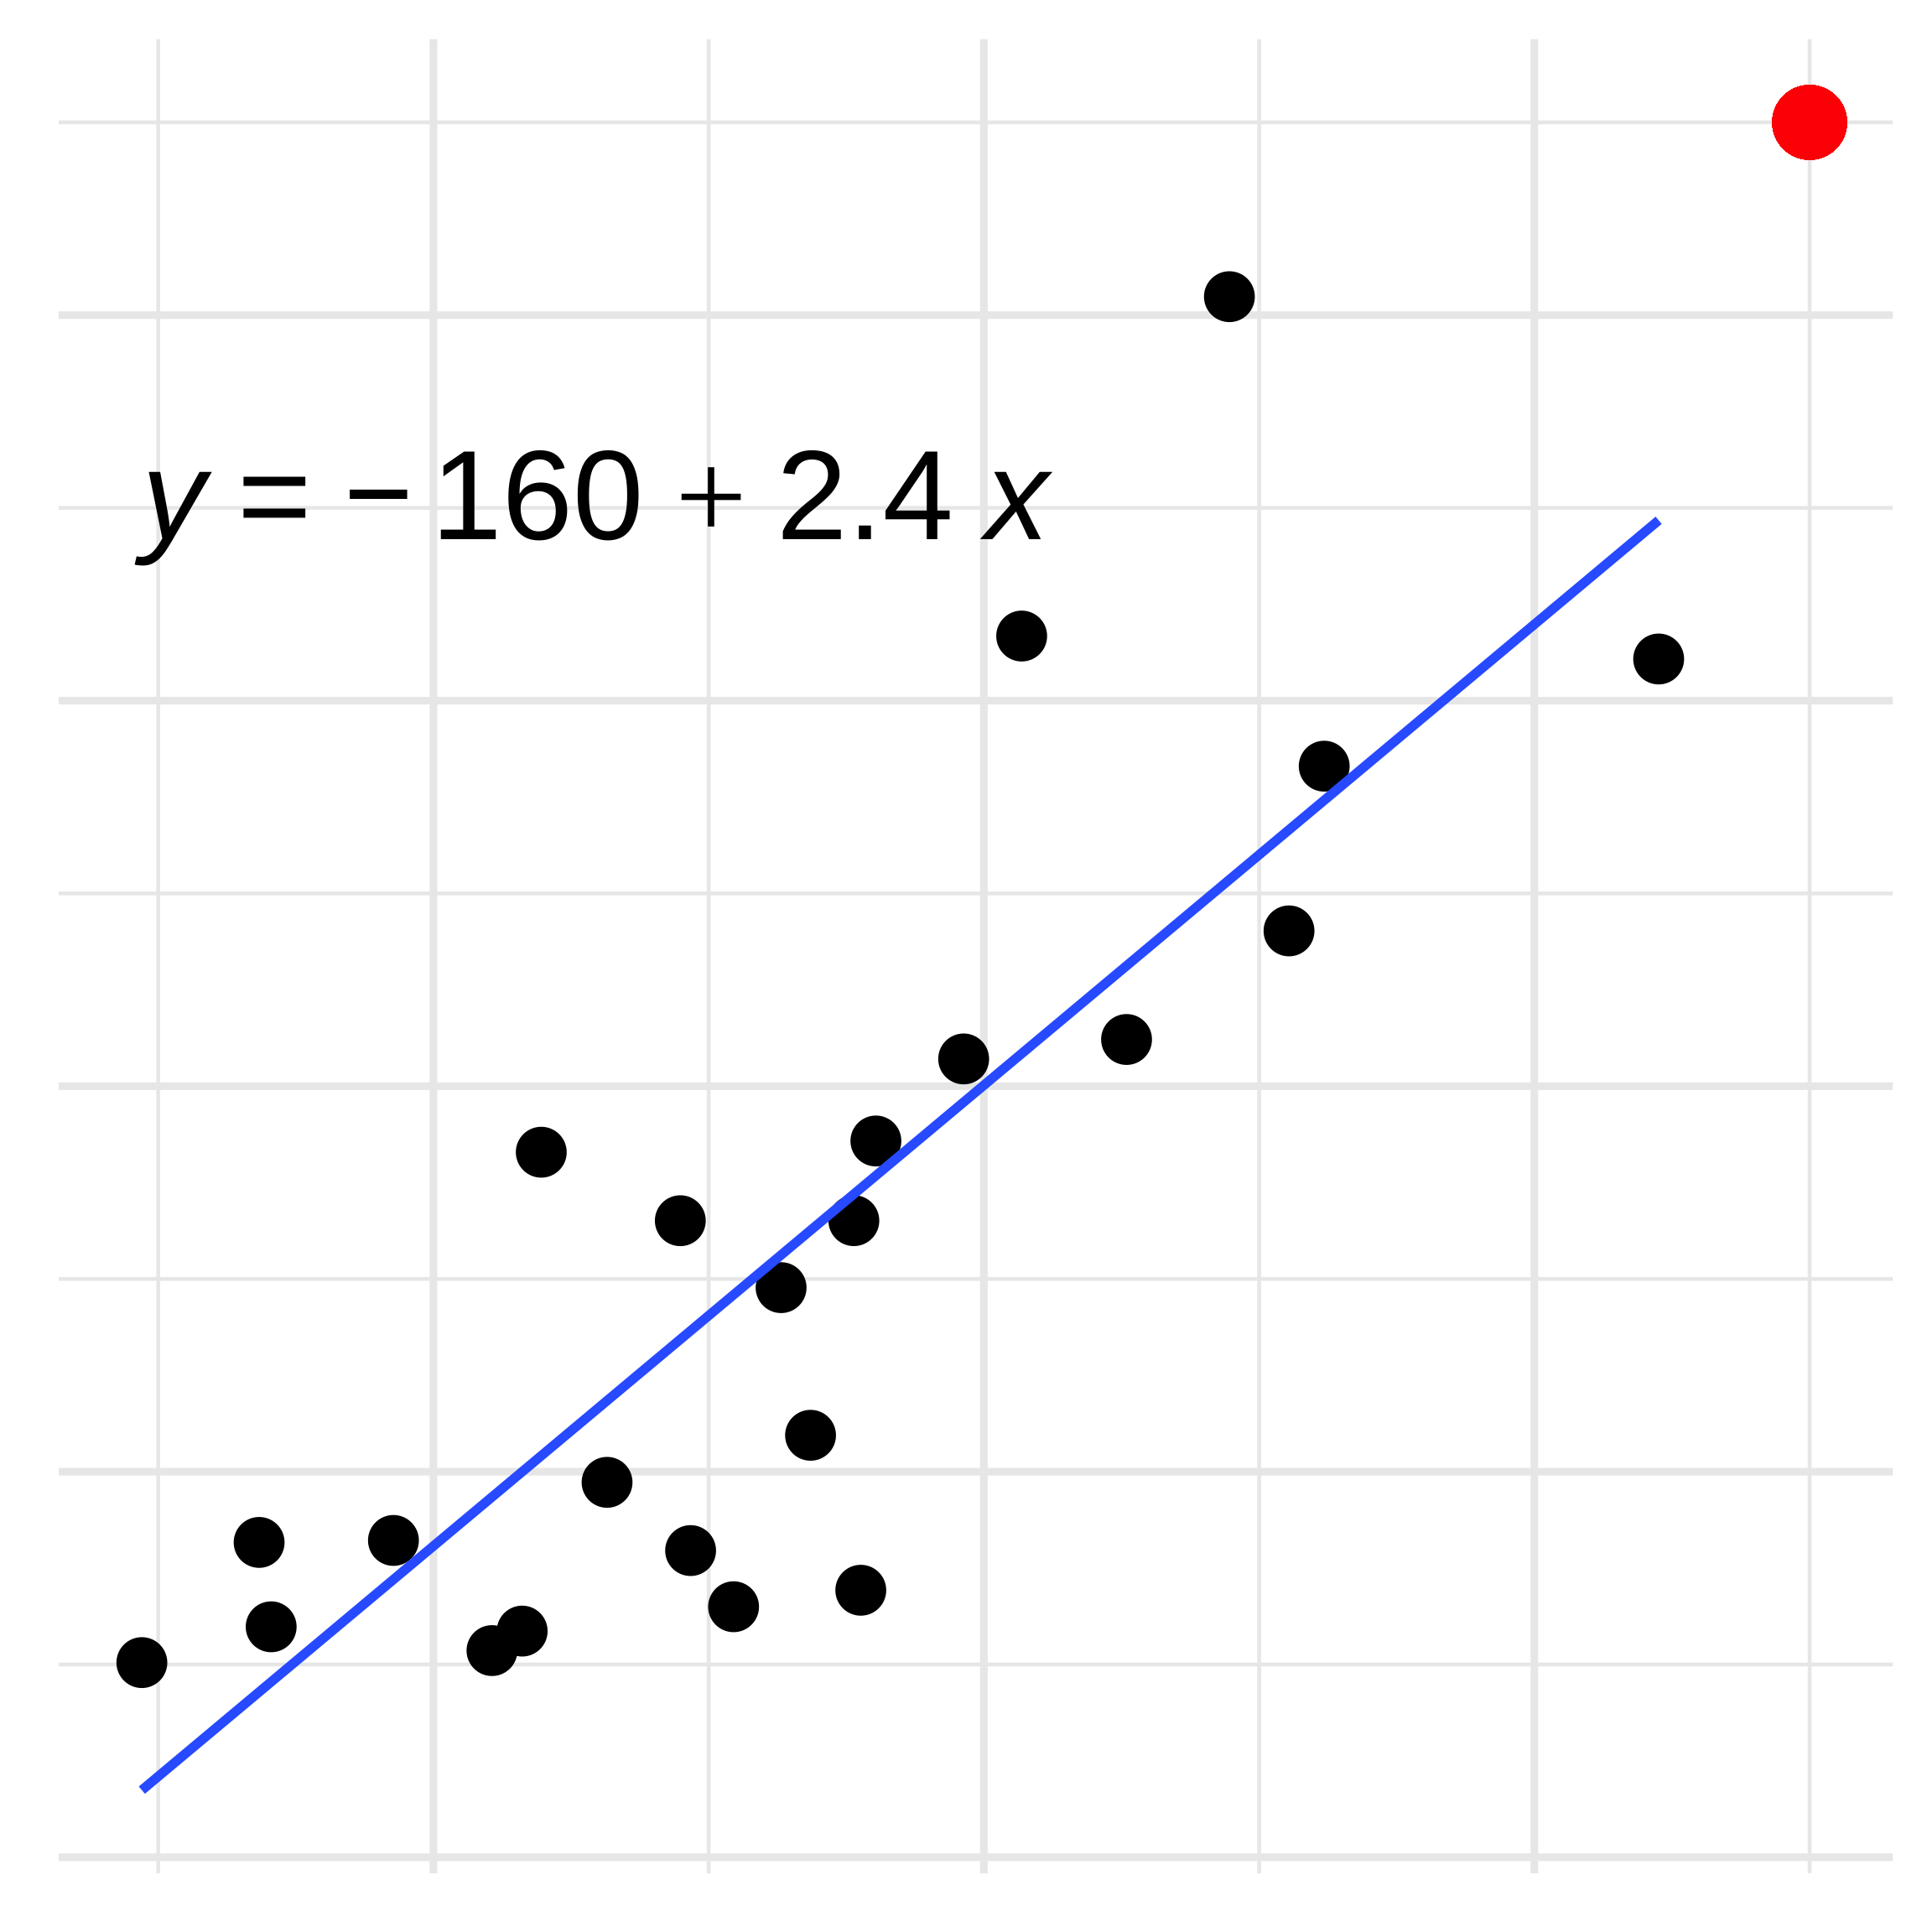
Can we make any inference about the new data point?
No, the point is outside of the bounds of our regression model.
This would be extrapolation, which is possible, but not advised.
Linear Regression: Extrapolation
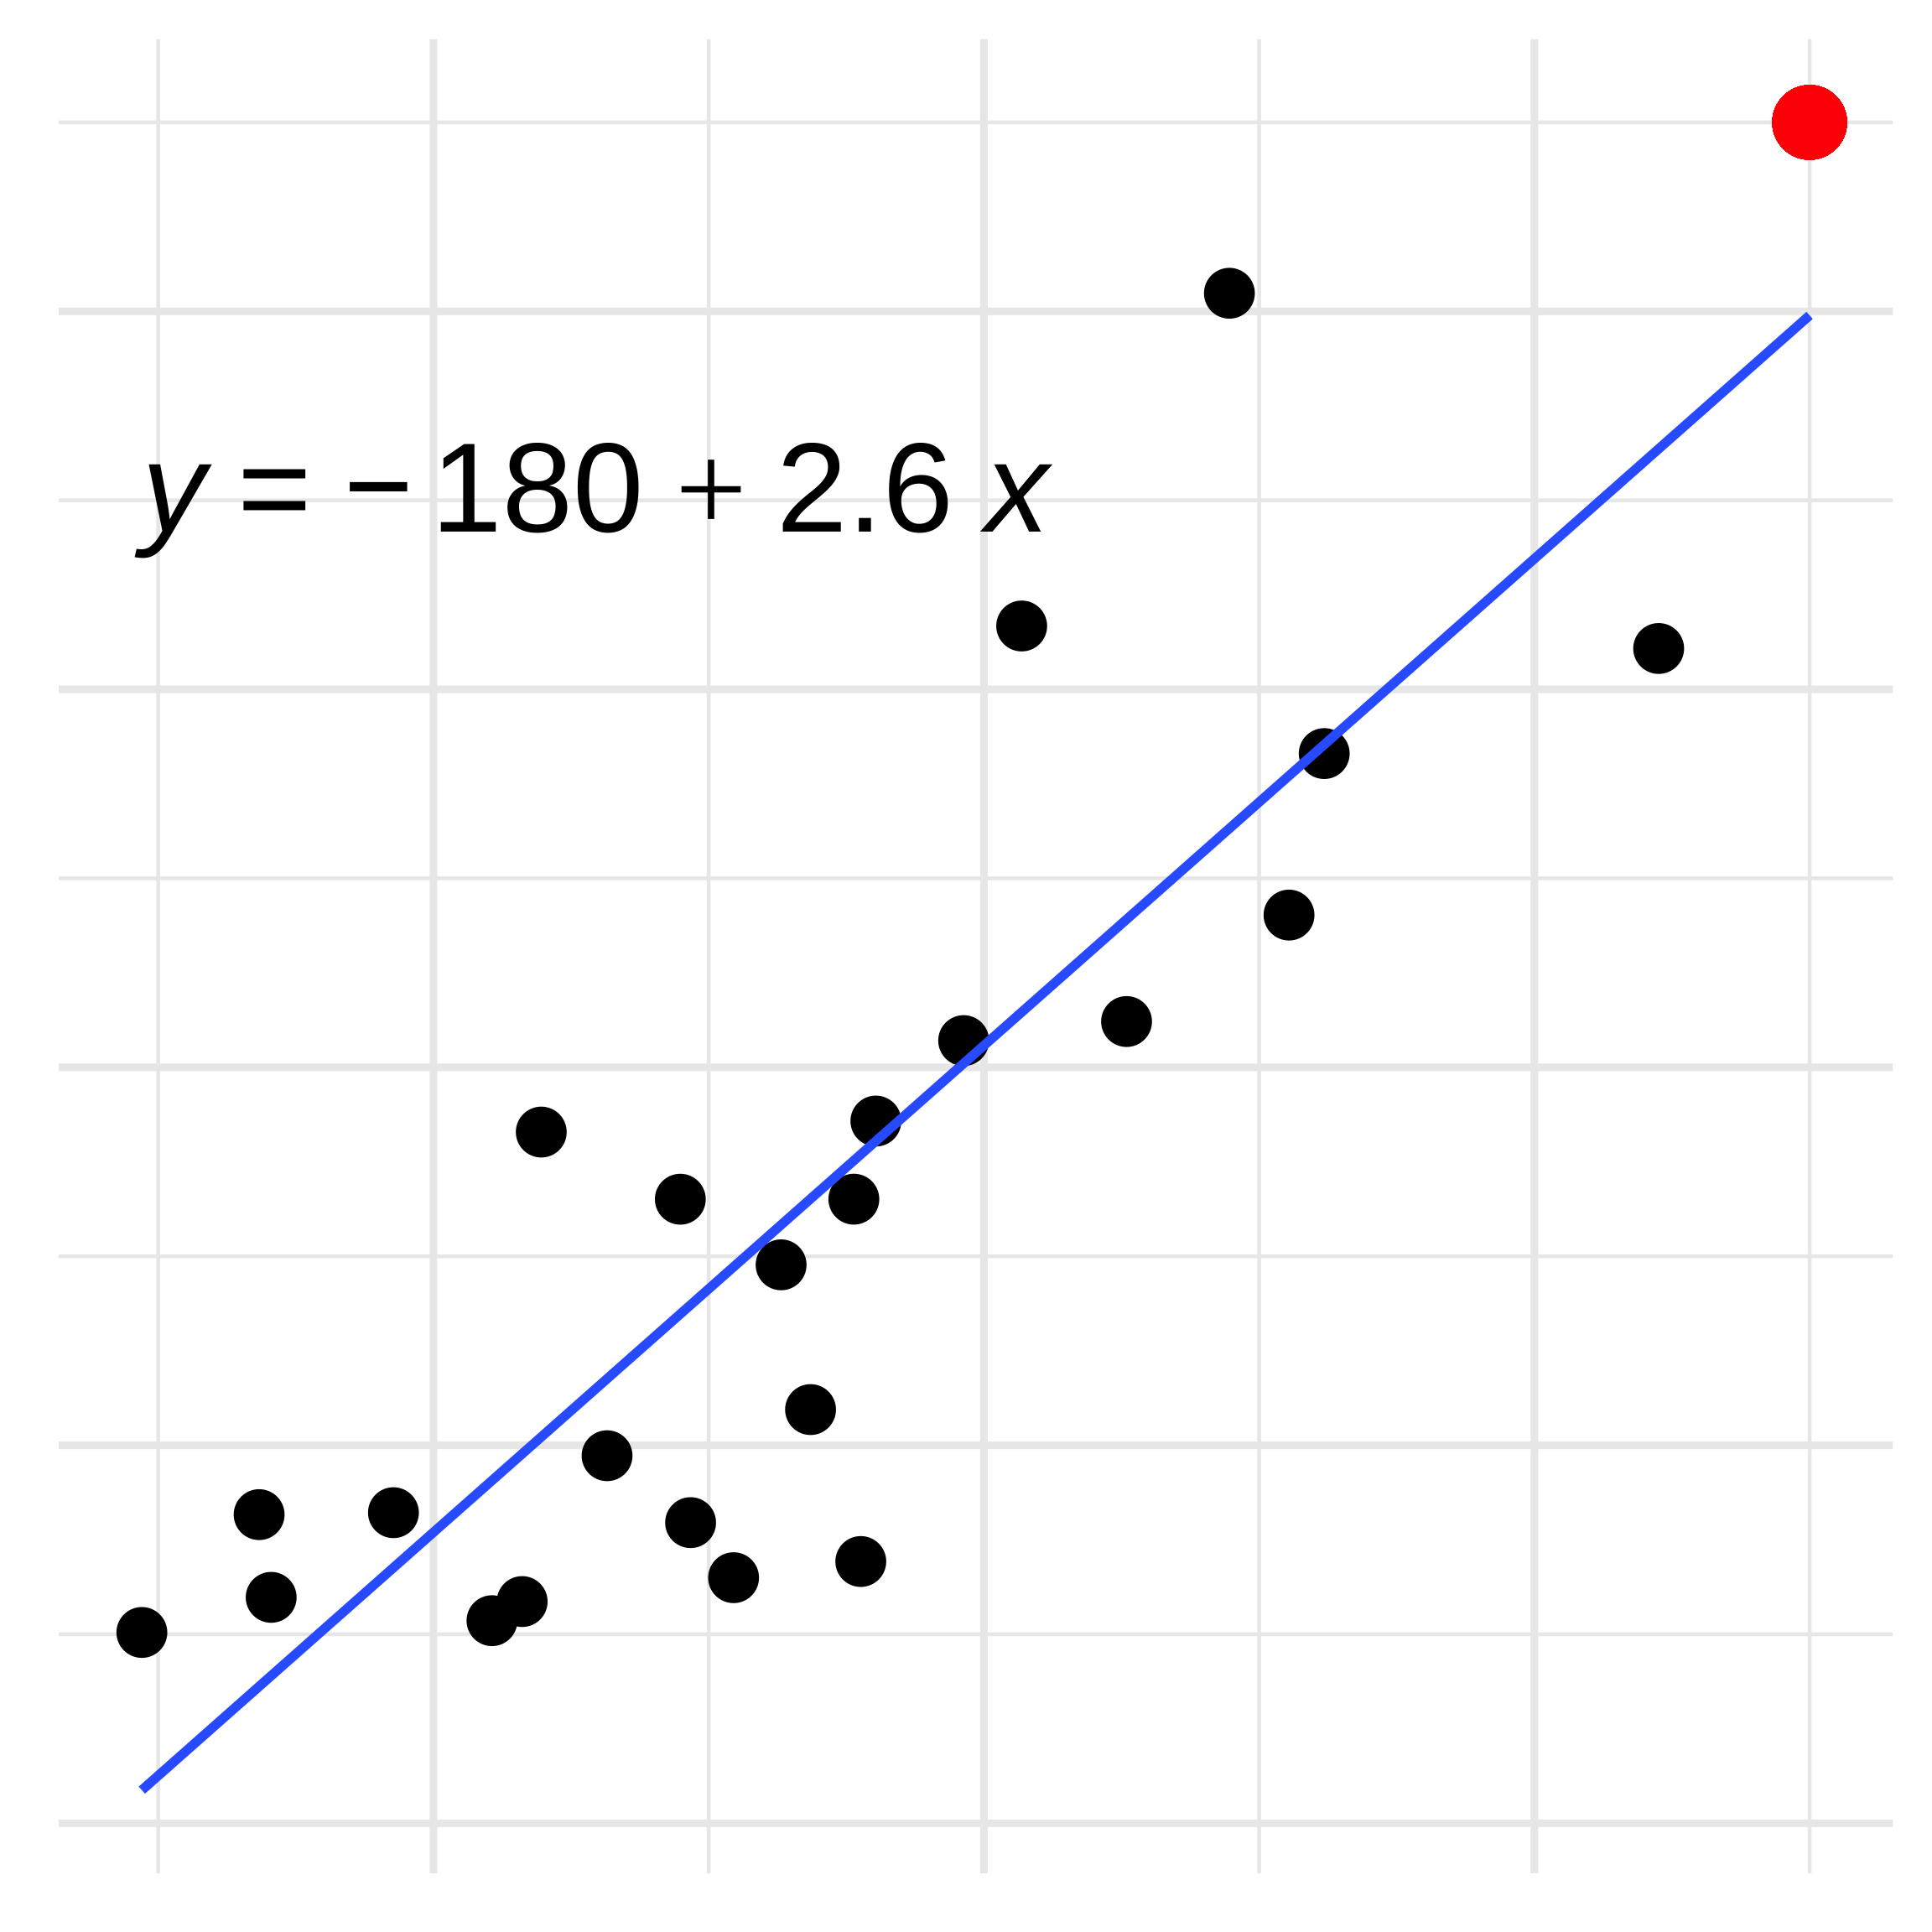
Instead you’d have to run a new model.
Correlation = Causation?
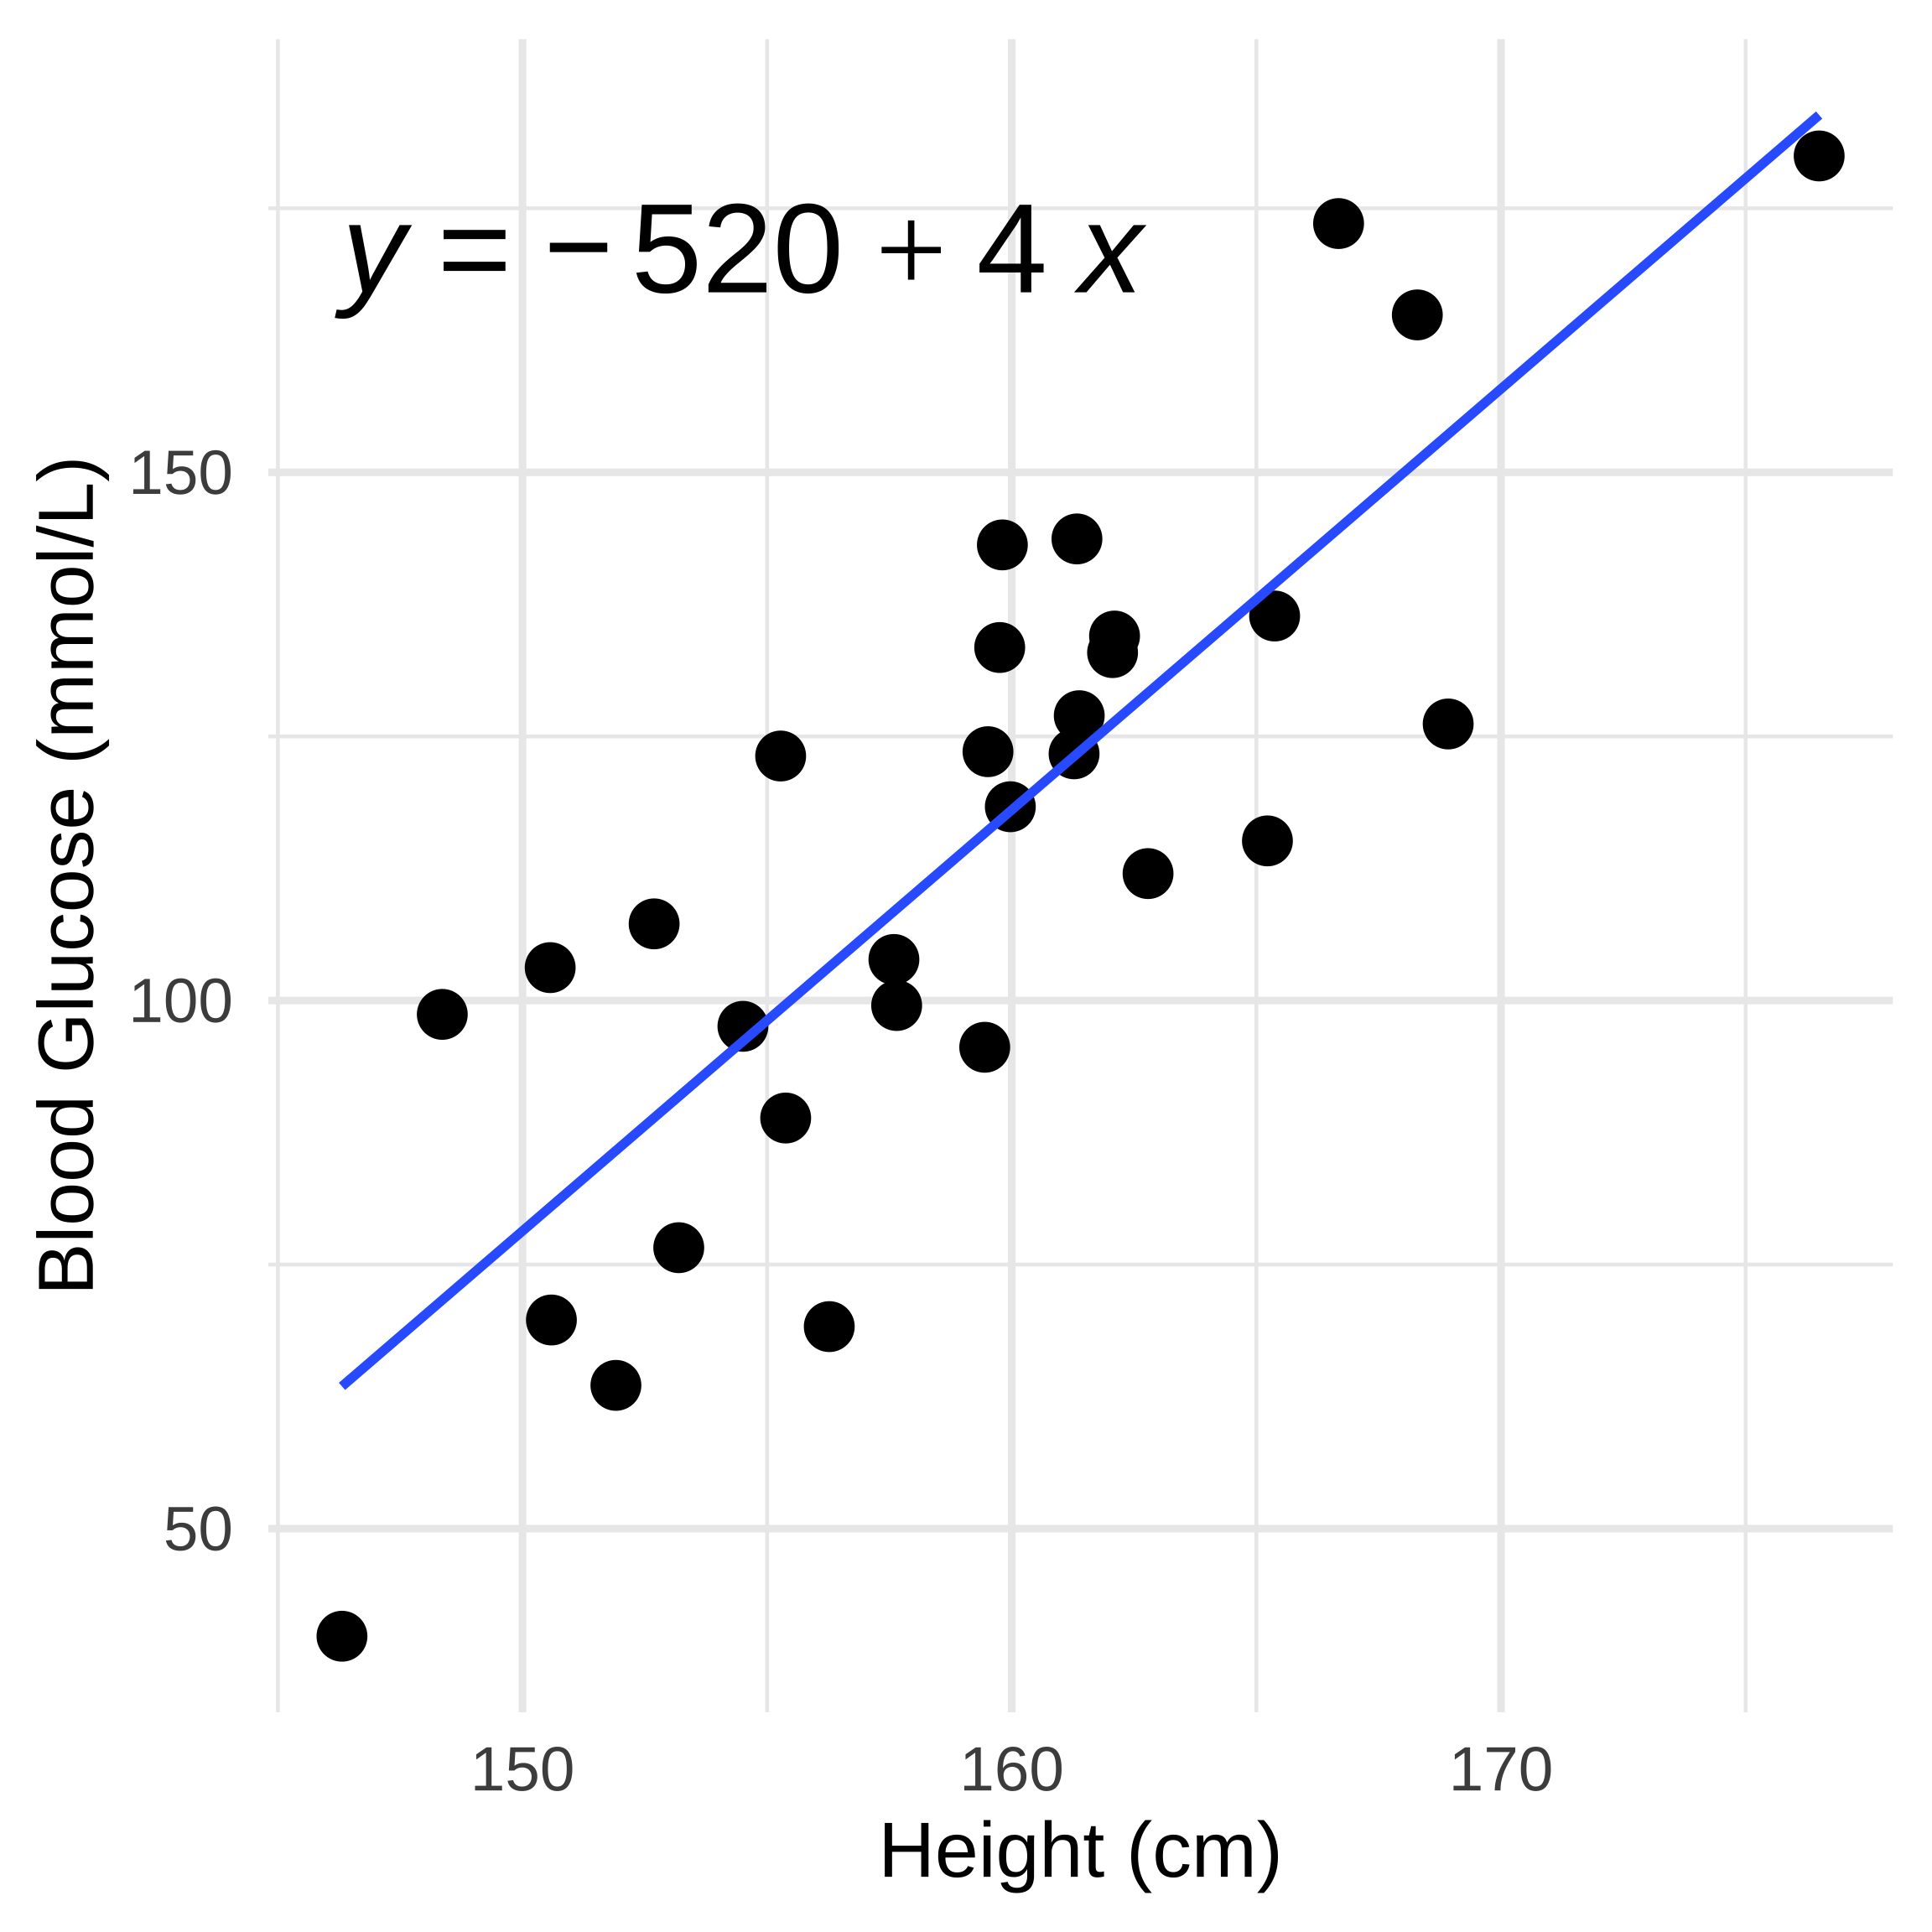
Is height (cm) related to Blood Glucose (mmol/L)?
Maybe…
There’s no information on how the data was collected or if this is experimental at all.
Done!!